Chapter 19: Audiology, Acoustic Countermeasures against Swarms and Building IFF Libraries
Student Learning Objectives
The student will explore the use of acoustic countermeasures against hostile UAS (especially Swarms) and their dual use as IFF vectors for UAS characterization. The student will take brief sojourn into the science of audiology to understand why acoustic countermeasures actually work.
Problem
The Risk of success of Terrorist Attacks on US Air Defense Systems (ADS) via sUAS / UAS is higher and improving because of commercial capabilities and accessibility. Advanced small drones capable of carrying sophisticated imaging equipment, significant (potentially lethal) payloads and performing extensive Intelligence, Surveillance, and Reconnaissance (ISR) missions are readily available to civilian market. They pose a significant threat to civilian and military UAS operations and safety in the NAS. The highest threats to ADS are presented by hostile UAS Swarms.
Problem Solution
The author’s research suggests that UAS Swarms can be both identified (IFF) and destabilized / mitigated /eliminated / countered in the air by applying harsh acoustic countermeasures at resonance frequencies. UAS (in any formation – especially Swarms) present detectable acoustic signatures that can be collected in an IFF sound libraries and like fingerprints or DNA they are unique to the make, model and origin manufacturer. Once identified as hostile, UAS (Swarm units) may be destabilized by harsh – explosive amplitude acoustic countermeasures to the MEMS or rotor base of the UAS’s causing destabilization of the UAS and grounding. Emergency and waypoint recovery functions do not work under this approach.
Review of key points from Chapter 8 Designing UAS Systems for Stealth
Detection Signatures
Recall from Chapter 8 Stealth, that UAS / UAVs are detected by their signatures: noise (acoustic), optical (visible), infrared (thermal) and radar (radio). “These acoustic or electromagnetic emissions occur at the following wavelengths: (Austin, 2010)
A) Noise (acoustic) [16 m-2 cm, or 20 – 16000 Hz]
B) Optical (visible) [0.4 – 0.7 um]
C) Infrared (thermal) [0.75 um – 1 mm]
D) RADAR (radio) [3 mm – 3 cm]” (Austin, 2010)
In the discussion on stealth, it was presented that “If the designer is to reduce the vehicle detectability to an acceptable risk level, it is necessary to reduce the received emissions or reflection of the above wavelengths (expressed as frequencies) below the threshold signature value. A good portion of the UAS signatures are a function of the operating height of air vehicle.” (Austin, 2010) The concept of frequency as a fifth realm was elucidated in terms of targets, battlespace, and wavelengths. One of the parameters, range was a serious limitation on performance. Range has a significant impact on radio transmission. Depending on the environment, the strength of a received signal, T, is a function of the square or fourth power of a distance, d, from the transmitter. (Adamy D. -0., 2015) The EMS was presented with emphasis on sound frequencies, many out of human hearing range. The author’s experiments were using DJI Phantom 4 at 400 ft. This is not a tactical distance for a countermeasure. However, the LRAD made by LRAD Corporation is effective to a mile. It was described in the C-UAS chapter.
Chapter 8 presented that for the UAS designer the upper end of noise – Stealth acceptability 17,150 Hz. The Stealth range is 20 Hz – 17,150 Hz.
Essentials of Audiology
The question is why would hitting a UAS going at 100 mph or more be susceptible to a loud noise hitting the MEMS under the rotors or the rotors themselves? Why would this same noise or variation thereof be capable of characterization of the UAS’s of a hostile or friendly power? It is not something we can just take for granted without understanding the essentials of audiology underlying the process.
For the Birds
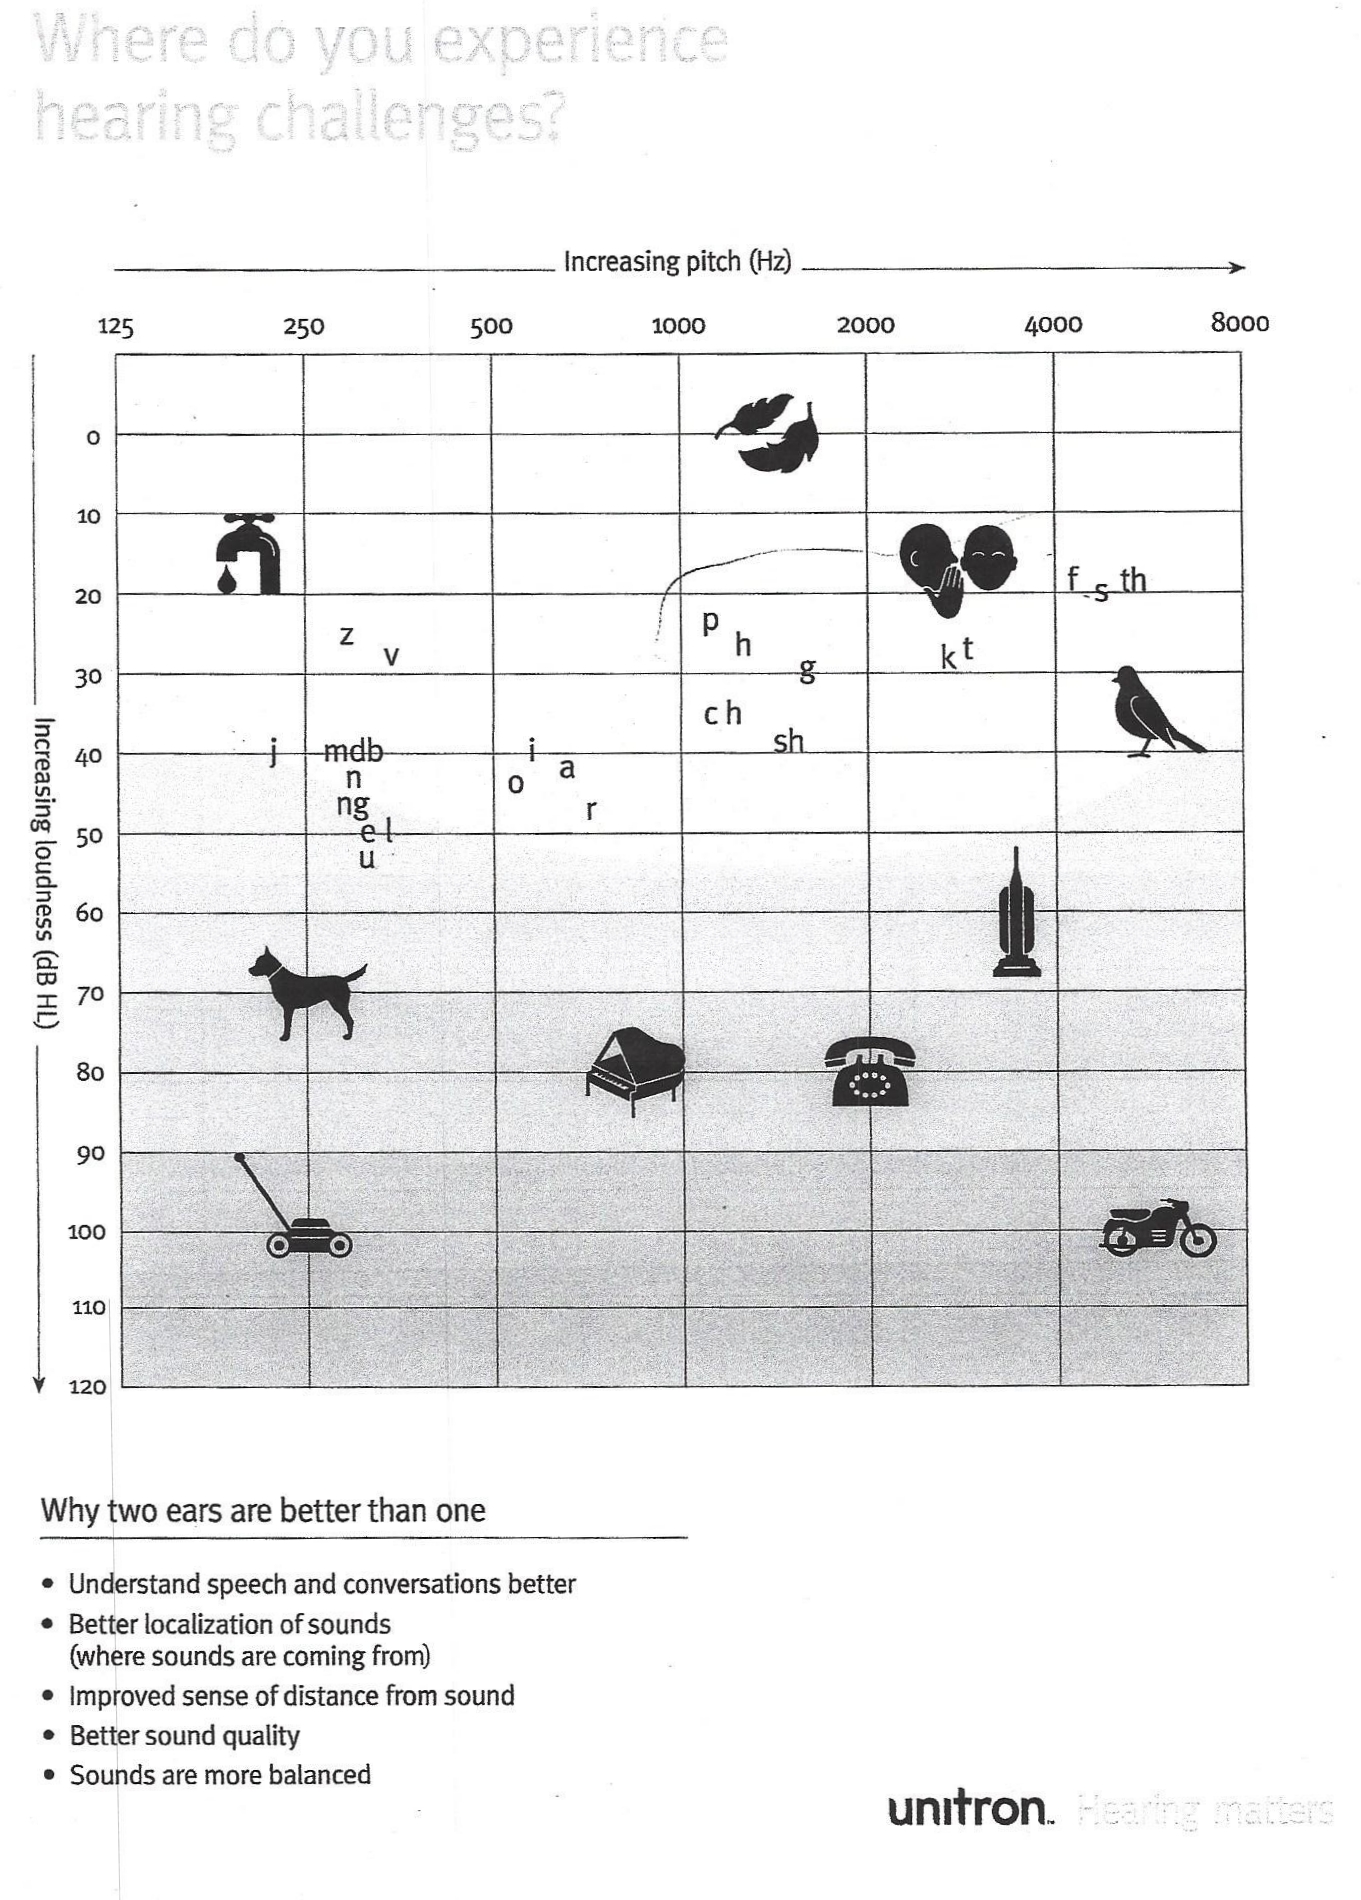
The author recently purchased two “Cadillac: hearing aids made by Signia. (Signia, 2019) They came with an Iphone application that permits all kinds of variation in frequency, tone, loudness, dampening factors, etc. and can be adjusted for universal, TV, reverberating rooms, chaos, party atmosphere, stadium, quiet, music hall and many other customizations. Sitting outside on my deck, I was able to match the frequency of chirping birds and graph their frequency as heard through my hearing aids. This is a different learning process from when the author wrote about speech cryptography in my Classical Cryptography Course, Volume I. [CCCI] (Nichols, Classical Cryptography Course, Volume I, 1996) In CCCI, he was trying to characterize and encrypt / decrypt speech patterns and make a library of those vowel -consonant patterns. Here the author is concerned with creating resonant frequencies to disrupt the delicate unprotected circuitry of a moving UAS vehicle in the air.
The author was able to jimmy-rig a transmitter at the frequencies below 16 MHz and send frequency tones about 50 feet at the birds in my backyard. My purpose was to emulate Identification Friend or Foe (IFF) conditions to the various birds feeding at my porch and trees nearby. In a non-scientific attempt to see what the sent signals (at bird frequencies matched to the birds’ chirping) would cause any, none, confusion, chaos, friendly, or hostile reactions. The rig was not capable of sending exact signals at resonance frequencies. (So, the birds didn’t explode or lose flying ability.) The object was to understand the audiology principles involved and to test conditions within the hearing range. Stop laughing for a moment. In the space of just two days, the author was able to characterize the following bird species: White-breasted Nuthatch, House Finch, American Robin, Blue Jay, Northern Mockingbird, House Wren, Tufted Titmouse, Baltimore Oriole, Morning Dove, Black-capped Chickadee, Northern Cardinal, White-throated Sparrow, a Common Flicker Woodpecker and a most irritating Red-Bellied Woodpecker (RBW) (who if exploded, would not cause the author tears). The author taped these sounds and tested the taped version through the computer on three of the above species with similar effects. Some of the larger birds reacted harshly / threatened. The smaller birds acted is if they were in love and wouldn’t shut-up even when the frequency stimulus was stopped. The RBW was unimpressed and kept up his chaotic bug – finding noises. Interestingly, only one bird was hit with my frequency simulator, while he was flying between trees – the House Finch. For a few brief moments the bird seemed to wobble and drop in a decreasing angular pancake fashion, and then recovering in midair. It is possible that the frequency transmitted was close to his resonating chirp – frequency. Then again, he might just have been yawning.
Audiology Fundamentals
The science of sound is called acoustics, which a branch of physics. Table 19-1 displays the principal physical quantities in MKS, cgs, and English units. Table 19-1 can be found in most engineering, physics or medical textbooks. (Entokey, 2019) It is the starting point of a trip uphill to resonance frequencies.
| Table 19-1: Principal Physical Properties (Entokey, 2019) and (Gelfand S. A., 2009) | |||||
| Quantity | Formula | MKS (SI)Units | Cgs Units | Comments | English Units |
| Mass (M) | M | kilogram (kg) | gram (g) | 1kg = 103 g
1kg = 2.2046 lbs |
pounds (lbs) |
| Time (t) | t | seconds, (s) | s | s | |
| Area (A) | A | m2 | cm2 | 1 m2 = 104 cm2 | ft2 |
| Displacement (d) | d | meter (m) | centimeter (cm) | 1m = 102 cm | ft |
| Velocity (v) | v = d/t | m/s | cm/s | 1 m/s = 102 cm/s | ft/s |
| Acceleration (a) | A = v/t | m/s2 | cm/s2 | 1 m/s2 = 102 cm/s2 | ft/s2 |
| Force (F) | F = MA = Mv/t
Mv = Momentum |
kg x m/s2
newton (N) |
g x cm2
dyne |
1N = 105 dynes | 1 lbf = 1 lb x 32.174049 ft-lbs /s2 = 9.80665 m/s2 |
| Pressure (p) | p = F/ A | N /m2
Pascal (Pa) |
dynes /cm2
microbar (µbar) |
20 µPa = 2 x 10⁻⁵ N/m2
reference value |
Psi = lbf /in2
1 N/m2 = 0.000145 psi |
| Work (W) | W =Fd | N x m
Joule |
dyne x cm
erg |
1 j = 107 erg/s
Energy -capability to do Work. Potential energy for a body at rest and kinetic energy for a body in motion. |
BTU
[British Thermal Unit] 1 BTU = 1055.056 joules |
| Power (P) | P = W/t =
Fd/t =Fv |
Joules/s
watt (w) |
erg/s
watt (w) |
1 w = 1 J/s = 107 erg/s | 1 watt = 3.412 BTU/hr |
| Intensity (I) | I = P/A
I = P / 4ℼr2 Based on sphere radius |
w/m2 | w/cm2 | 10-12 w/m2
reference value |
|
Source: (Entokey, 2019) and (Studios, 2017)
Figure 19-1: Inverse Square Law, Sound Intensity
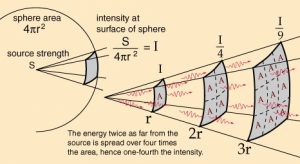
Source: (Uni-wuppertal, 2019) [Author revision for background color]
Intensity and Inverse Square Law
“Sound radiates outward in every direction from its source. This constitutes a sphere that gets larger and larger with increasing distance from the source.” (Entokey, 2019) Figure 19-1 shows the relationship between Intensity and the Inverse Square Law. (Uni-wuppertal, 2019) Intensity (I) (power divided by area) decreases with distance from the original source because of finite amount of power is spread over increasing surface area. (Entokey, 2019) Proportionately less power falls on the same unit of area with increasing distance from the source. (Gelfand, 2004)
“Four important relationships to note are that power is equal to pressure squared, P = p2, pressure is equal to the square root of power, p = √ P, intensity is proportional to pressured squared,
I ≈ p2 and pressure is proportional to intensity, p ≈ √I. This makes it easy to convert between sound intensity and sound pressure.” (Entokey, 2019) These relations yield a few more to relate sound pressure, sound intensity and distance r. Given to pressures p1 and p2 at distance r1 and r2, they are proportional: p2 / p1 = r1 / r2; and factoring in intensities at I1 and I2, gives I2 / I1 = (r1 /r2)2.
Finally, r2 / r1 = p2 / p1 = √I1 / I2. (TRS, 2018)
Decibels (Adamy D. , 2001) (Gelfand S. A., 2009)
Sound magnitudes, intensities, and pressures vary over an enormous range. We use decibels (dB) to express sound values. Decibels takes advantages of ratios and logarithms. Ratios are used so that physical magnitudes can be stated in relation to a reference value that has meaning to us. The reference point chosen is the softest sound that can be heard by normal people. The reference value has an intensity of 10-12 w/m2 (10-16 w/cm2). In terms of sound pressure, the reference value is: 2 x 10⁻⁵ N/m2 or 20 µPa (2 x 10⁻⁴ dynes/cm2). An interesting Geek bar bet is what is the logarithm of all 2:1 ratios, 8:4, 20, 20:10, 100:50, etc.? Even though the distance between absolute numbers gets wider, 1,4,10, 50…, the logarithms of the 2:1 ratios are the same at 0.3. Another interesting factoid about ratios is the units generally cancel out.
The general decibel formula in terms of power level (PL) is as follows (Gelfand, 2004):
Eq. 19-1
PL = 10 log P / Po
Where P = power of the sound measured, and Po is the reference power to be compared.
The general decibel formula in terms of power level (IL) is as follows (Gelfand, 2004):
Eq. 19-2
IL = 10 log I / Io
Where I = intensity of the sound measured, and Io is the reference intensity to be compared. Io is given as 10-12 w/m2 .
The general decibel formula for sound pressure level (SPL) is obtained by replacing all of the intensity values with the corresponding values of pressure squared because (I ≈ p2).
Eq. 19-3
SPL = 10 log p2 / po2
Where p is the measured sound pressure (in N/m2) and po is the reference sound pressure of 2 x 10⁻⁵ N/m2 . A more convenient form of this equation recognizes that log x2 = 2 log x. (Gelfand, 2004)
Eq. 19-4
SPL = 20 log p / po.
Equation 19-4 is the common formula for SPL. A couple of observations a positive decibel value means that the sound pressure level is greater than the reference. The decibel value of the reference is 0 because reference value / reference value = 1 and 10 log 1 = 0. This does not mean no sound, it just means the sound measured is equal to the reference point. A negative value of decibels means that the sound magnitude is lower than the reference. (Gelfand S. A., 2009)
Figure 19-2 shows common decibel and Intensity levels within the hearing range. This does not consider environment, frequency differences or noise (discussed presently). It does show the ease of which decibels may be used to rank the sound intensity levels which vary greatly in magnitude. [1]Hearing aids are effective from about 6 – 90 decibels. Above 90 dB, they can dampen but not eliminate the very loud sounds unless there is complete loss of hearing.
Figure 19-2 shows common decibel and Intensity levels within the hearing range
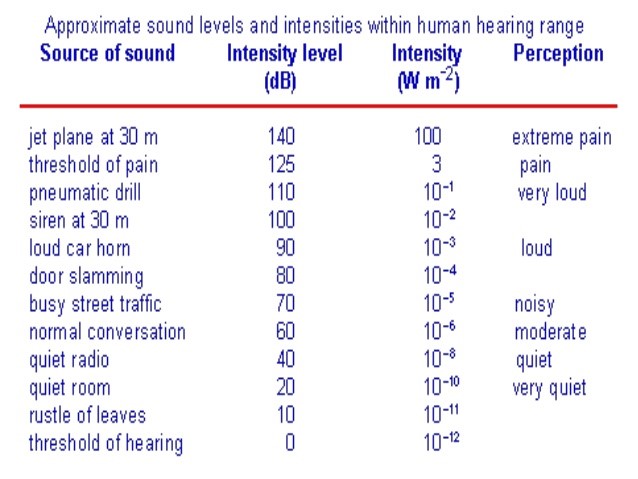
Source: (Carter, 2012)
The Nature of Sound
“Sound is defined as a form of vibration that propagates through the air in the form of a wave. Vibration is the to-and-fro motion (aka oscillation) of an object. Some examples are playground swing, tuning fork prong, air molecules and UAS rotor blades [circular motion]. The vibration is called sound when it is transferred from air molecule to air molecule. This transfer may be simple like a tuning fork or a very complex pattern like the din in a school cafeteria. Naturally occurring sounds are very complex.” (Entokey, 2019) UAS sounds are not natural and supported by machinery, hardware and software. Three weaknesses of the UAS are the MEMS, gimbal assembly and rotors. Although stealth mechanisms may be employed to reduce noise emissions, the former parts are exposed. They do produce discernable signatures.
Figure 19-3: Tuning for Oscillations
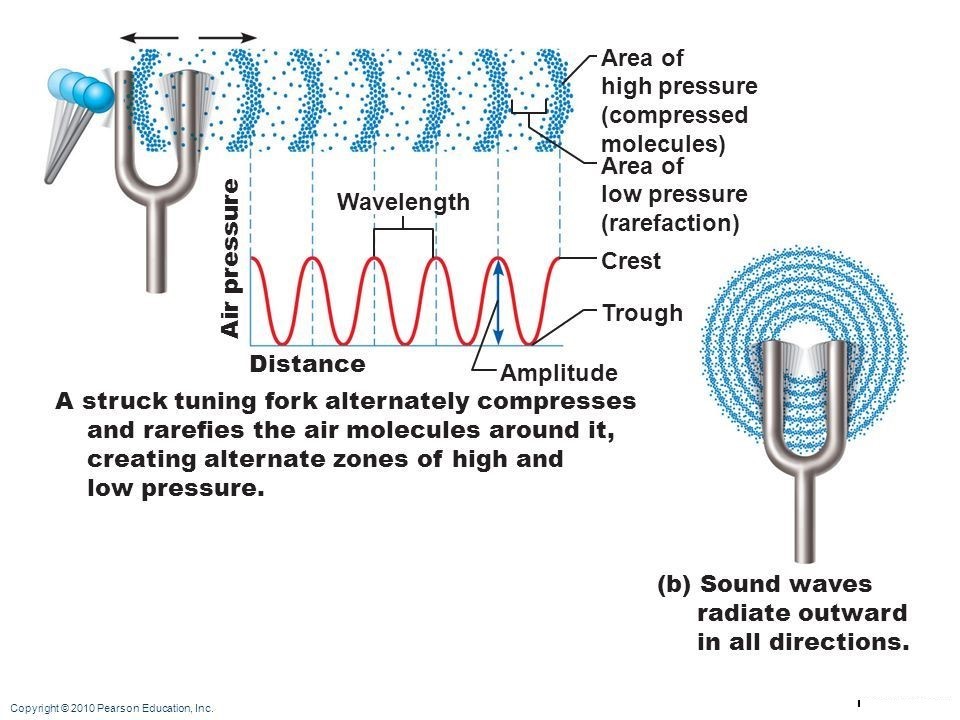
Source: (Pierson, 2019)
A tuning fork illustrates the oscillations of sound. After being struck, the tuning fork vibrates with a simple pattern that repeats itself over time. (Entokey, 2019) Figure 19-3 shows that the tuning fork when struck exerts a force on the air molecules which alternatively exerts a high pressure (compression) and a low pressure (rarefaction) zones. The zones exhibit wave amplitude and wavelength as a function of air pressure and distance. The sound wave is distributed in 360 degrees through the air.
Figure 19-4: Tuning fork oscillations over time
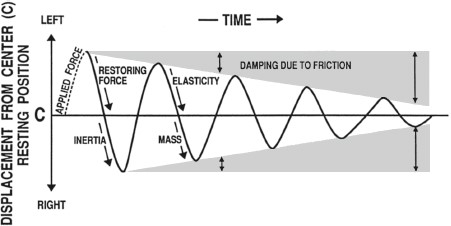
Source: (Entokey, 2019)
Figure 19-4 diagrams tuning fork oscillations over time. Sounds that are associated with simple harmonic motion are called pure-tones. Vertical displacement amount of the tuning fork prong displacement around its resting position. Distance from left to right represents progression of time. One complete round-trip or replication of an oscillating motion is called a cycle. The number of cycles occurring in one second is the frequency. The duration of one cycle is called its period. This form of motion occurs when a force is applied to an object having properties of elasticity and inertia. Simple harmonic motion (SHM) shows the same course of oscillations as in Figure 19-4 because they repeat themselves at the same rate until friction causes dampening of the waveform. (Entokey, 2019) and (Gelfand S. A., 2009)
Other Parameters of Sound waves
Probably the most useful SHM waveform is the sinusoidal wave or sine wave.[2]
The number of times a waveform repeats itself in one second is known as the frequency or cycles per second (CPS). (Gelfand S. A., 2009)Two useful relationships are: f = 1/ t or t = 1/f; where f is the frequency in cps and t is the period in seconds. Amplitude denote the magnitude of the wave. The peak- to – peak amplitude is the total vertical distance between negative and positive peaks. The peak amplitude is the distance from the baseline to one peak. The magnitude of sound at any instant is the instantaneous amplitude. Wavelength (λ) is the distance traveled between one peak and the next. (Gelfand, 2004)
Wavelength formula is: λ = c / f, where c is the speed of sound in air (344 m/s. f is the frequency of sound in Hz. Similarly, frequency is inversely proportional to wavelength or f = c / λ. (Gelfand S. A., 2009) Another interesting sound parameter is Pitch. Pitch is the quality of sound and especially a musical tone governed by the rate of vibrations producing it. It is the degree of highness or lowness of sound. (Merriam-Webster, 2019)
Complex waves
When two or more pure-tone waves are combined, the result is a complex wave. (Gelfand, 2004) They may contain any number of frequencies. Complex periodic waves have waveforms that repeat themselves. If they don’t they are aperiodic. Combining waves may reinforce themselves or cancel themselves whether they are in phase or out. The lowest frequency component of a complex periodic wave (like a combination of sign waves) is called its fundamental frequency. (Gelfand, 2004)
Harmonics are whole number or integral multiples of the fundamental frequency. Waveforms show how amplitude changes with time. (Gelfand, 2004) Fourier’s Theorem shows that complex sound waves can be mathematically dissected into its pure tones.
Of more interest to UAS designers are aperiodic sounds which are made up of components that are not harmonically related and do not repeat themselves over time. The extreme cases of aperiodic sounds are transients and random noise. A transient is an abrupt sound that is very brief in duration. Random noise has a completely random waveform, so it contains all possible frequencies in the same average amplitude over the long run. Random noise is also called white noise like white light because all possible frequencies are represented.
Patient D v-105 (Heinman, 2019)
Let’s look at some of the discussed sound parameters in a real patient. Data was collected by audiologist in an anechoic[3] sound chamber.[4] Refer to Figures 19-5 and 19-6. Note that the standard ANSI 1969 runs from 250 Hz to 10,000 Hz. Average hearing range is from 250 Hz – 8,000 Hz. Patient D v-105 has lost hearing in the upper ranges. Patient hearing declines precipitously after 2,000 Hz in both ears. The patient requires a louder (more dB) threshold stimulus as frequencies go above 1500 Hz in the right ear and above 1000 Hz in the left. Patients most comfortable level is 60 dB in both ears. This corresponds to 400 Hz in right ear and 3,500 Hz in the left. Patient experience pain / discomfort at 95 dB. From Figure 19-2, 60 dB is moderate intensity normal conversation. 95 dB is a siren on a police car. Patient can pick up speech sounds at 15 /20 dB or comparable to a quiet room. Patient D v-105 experiences difficulty in differentiating consonants above 2,000 Hz or k, t, f, s, and th. (Heinman, 2019)
Because of pitch, Patient D -v105 would be able to hear and differentiate many bird calls and chirping below 4,000 Hz and would be able to hear the bird noises above 4,000 Hz with hearing aid assistance. UAS noise levels range from 250 Hz to 20,000 Hz so Patient would not be able to hear the UAS directly but could IFF with the appropriate LRAD.[5]
Figure 19-5: Patient D v-105 Hearing loss
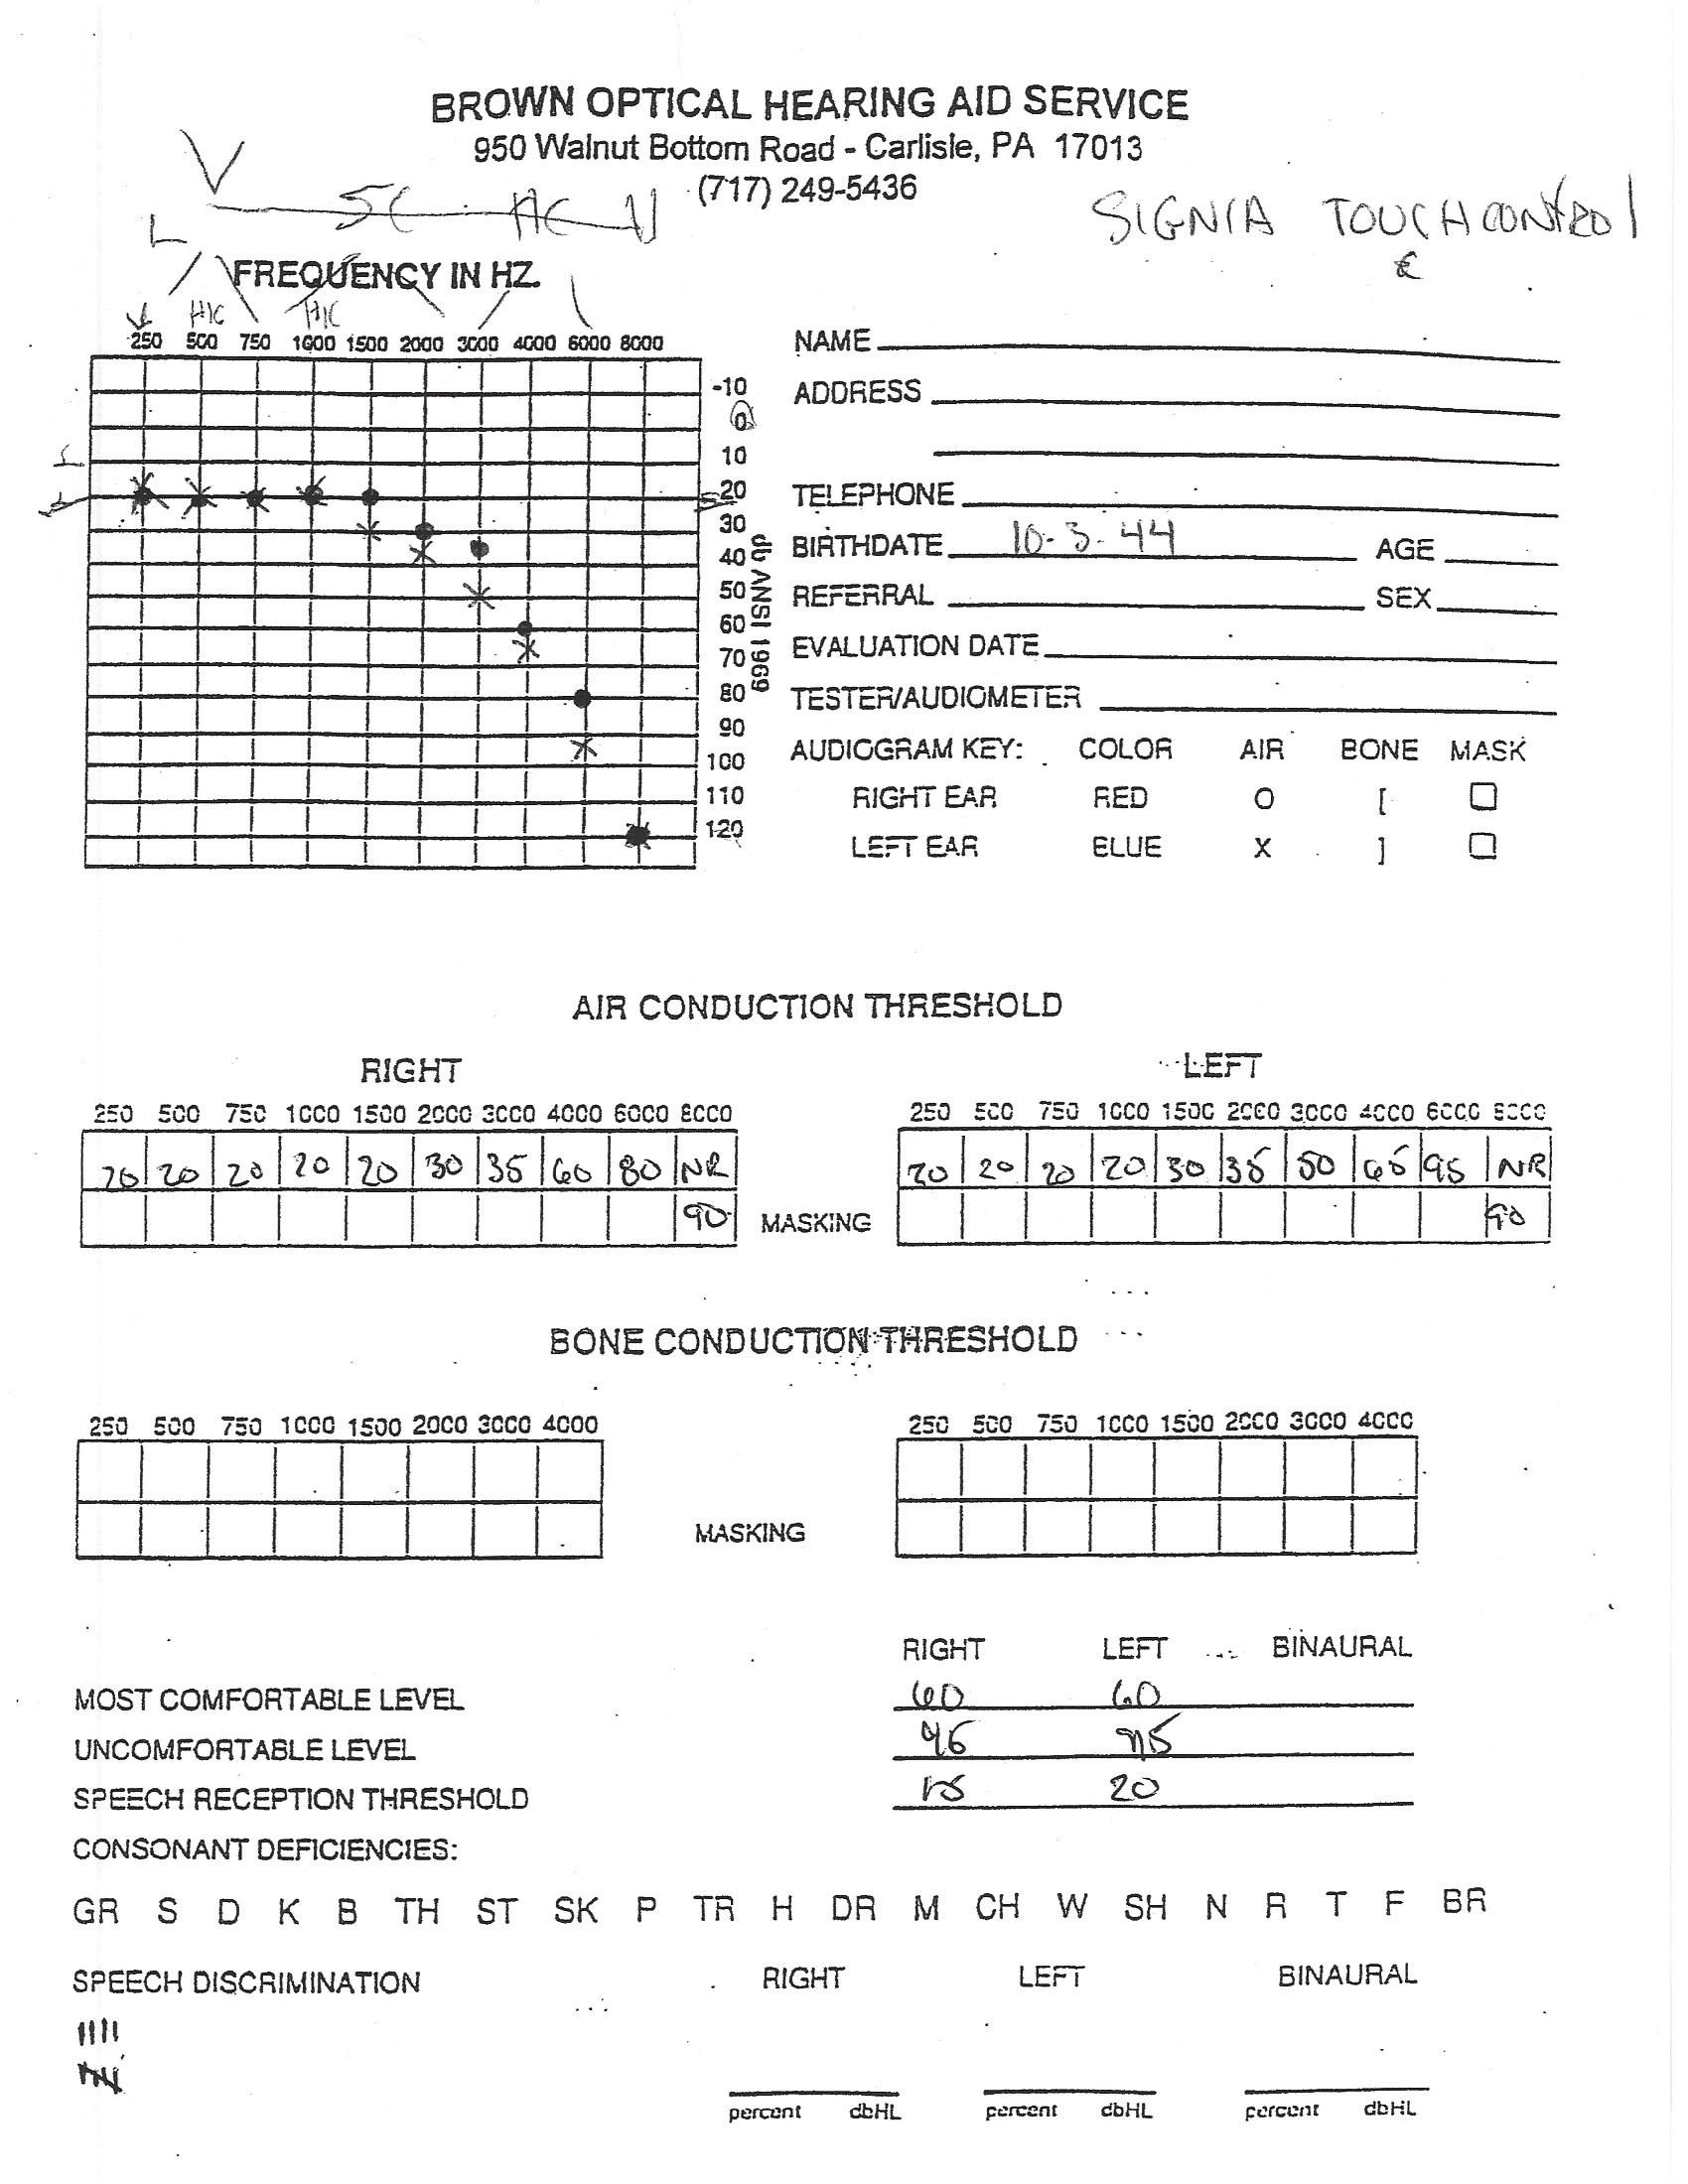
Source: (Heinman, 2019)
Figure 19-6: Patient D v-105 Pitch v Loudness V Consonant Loss
Source: (Heinman, 2019)
Standing Waves and Resonance
We have arrived at the crux of the acoustic CM discussion, the natural or resonating frequency.
“The frequency(ies) at which a body or medium vibrates most readily is called its natural or resonant frequency(ies).” (Gelfand S. A., 2009) Differences in resonance frequency ranges enable different devices to act as filters by transmitting energy more readily for certain high, low, or bandpass frequencies. UAS with multiple rotors circulate the rotors to gain lift and / or hold steady / or descend in altitude. Four, six, eight – rotor UAS maintain control via internal SCADA systems and send critical information through a MEMS component located at the bottom of rotors. Rotor frequencies are coordinated, monitored, and position -controlled through the MEMS and in-board computers. Even though the rotor(s) motions are spinning in circular fashion, the sound wave generation is not curvilinear, or aperiodic but transferred up through the Y axis and back again to its base as it ascends in altitude. There is a tendency to maintain equilibrium in terms of position of the UAS.
The author contends that the UAS rotor systems act like vibrating strings and resonance frequency information can be approximated by this approach. An example of a vibrating spring is when you “pluck” a guitar. The waves initiated move outward toward the two tied ends of the string. The waves are then reflected back, and they propagate in the opposite directions. The result is a set of waves that are moving toward each other, resulting in a perturbation sustained by continuing reflections from the two ends. The superimposed waves interact and propagate and appears as a pattern that is standing still. Peaks (maximum displacement) and no displacement (baseline crossings occur at fixed points along the string. Places along the spring where zero displacement in the standing wave pattern are called nodes. (Gelfand, 2004) Locations where the maximum displacement occurs are called antinodes.
Figure 19-7: Standing wave
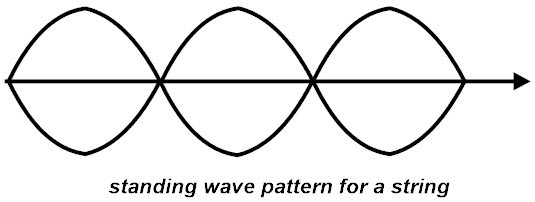
Source: (Administrator, 2015)
“The fundamental frequency is defined as the lowest frequency of a periodic waveform. It is generally denoted as ‘f’. The lowest resonating frequency of a vibrating object is called as fundamental frequency.” (Administrator, 2015)
“Harmonic is a frequency, which is an integer multiple of the fundamental frequency. The forced resonance vibrations of an object are caused to produce standing waves. At the natural frequency it forms a standing wave pattern. These patterns are created at specific frequencies, they are called Harmonic Frequencies or Harmonics.” (Administrator, 2015)
“The sound produced by a waveform at its harmonic frequency is very clear, and at other frequencies we get noise, and cannot hear the clear sound of waves. Harmonics may occur in any shaped wave forms, but mostly they occur in sine waves only. Non – sinusoidal waveforms, like triangular and sawtooth waveforms are constructed by adding together the harmonic frequencies. The word harmonic is generally used to describe the distortions caused by different undesirable frequencies called noise, of a sine wave.” (Administrator, 2015)
“Node and antinodes occur in a wave form. So, the waves have harmonic frequency in them. The fundamental frequency is the smallest frequency in a harmonic. Hence there is only a single anti-node occurs between them. This Antinode is middle of the two nodes. So, from this we can say that the guitar string produces longest wavelength and the lowest frequency.” (Administrator, 2015)
“The lowest frequency produced by any instrument is called the fundamental frequency. This is also known as first harmonic of the wave. In words of fundamental frequency, harmonics are the integer multiples of the fundamental frequency.” (Ex: f,2f,3f,4f, etc.… are harmonics.) (Administrator, 2015)
“Because of multiple integers of fundamental frequency, we will have n number of harmonics like 1st harmonic, 2nd harmonic,3rd harmonic, and so forth.” (Administrator, 2015) “The fundamental frequency is also called as First harmonic. In the first harmonic, we have two nodes and one anti -node. he numbers of antinodes are equal to the integer multiples of specific harmonics. i.e., for 1st harmonic we have 1 antinode, for 2nd harmonic we have 2 antinodes etc.” (Administrator, 2015)
The formula for the string’s resonant frequency Fo is:
Eq 19-5
Fo = 1 / 2L x √T /M
Where Fo is resonance frequency in Hz, T is Tension, M is Mass, L = λ /2 and f = c / λ and c = speed of sound. L = length of the string. (Gelfand, 2004) The strings lowest resonant frequency is f = c / 2 L but Eq 19-5 considers that the speed of sound is different for a vibrating string than it is for air.
UAS / Acoustic Countermeasures FAQ (Nichols, Hardening US Unmanned Systems Against Enemy Counter Measures, 2019)
The reader has questions, so here are the most likely questions and answers.
In terms of UAS Countermeasures, why are Acoustics so important? (Nichols, Hardening US Unmanned Systems Against Enemy Counter Measures, 2019)
They are important because:
- Offensive systems use ultrasonic frequency resonance
- Cannot be heard by humans when used to intercept a drone
- Passive systems are difficult, if not impossible, to detect
- Able to identify and track drone based on acoustic and/or visual signature
- Acoustic detection systems are limited in range ~ 350 ft to 500 ft due to environmental variables BUT commercial companies like LRAD, Corporation have developed long range acoustic devices which can detect a UAS up to a mile away at altitude.
- Can be a cost-effective way to defend a small area –especially against Swarm Attacks
Acoustic Signature Reductions (Nichols, Hardening US Unmanned Systems Against Enemy Counter Measures, 2019)
Can the UAS signatures be reduced?
- Noise may be the first warning of its presence
- However, it may not immediately be directionally/locatable for detection
- UAS noise emanates predominantly from vortices, tips of wings, rotors, or propellers
- Lowering wing span or blade span enhances acoustical stealth
- Conventional propulsion systems are a concern because of the noise of combustion
- Electric motors develop virtually no noise
- Reducing mass and aerodynamic drag of the UAS reduces noise generation
What are the Acoustic Detection Issues?
Detection relies on uniqueness of the UAS and hearing capabilities at low frequencies:
- Detects drones by recognizing the unique sounds produced by their motors
- Rely on a library of sounds produced by known drones, which are then matched to sounds detected in the operating environment, however
- The human ear is a problem for the designer
- It is most sensitive to frequencies around 3500 Hz and can hear sound down to a practical threshold of 10 dB
- For a given sound pressure level, attenuation of sound with distance in air and insulating material varies as the square of the sound frequency
- Low frequency sound presents a greater problem for UAS stealth design
- The greater noise problem is posed by smaller UAS using piston engines
- Sound comes from their internal combustion and exhaust systems
- Sound emission can be reduced with sound-absorptive materials, silencers and mufflers and by directing the intake and exhaust manifolds upward
- Level of sound detected depends on the level of background noise for sound contrast
- Limited range to 500 feet (experimental and research – not commercial or military)
- Noisy backgrounds (airports, city downtown) limit detection & interdiction
- Drone tuning (changing the stock propellers) limits detection / Interdiction
Is Acoustic Quieting possible?
“Yes, under certain conditions:
- Disguise sounds from sensors to eliminate its noise and passive echoes
- “Acoustic superiority” used by the Navy to mask detection of U.S. submarines
- Acoustic technology is “passive,” meaning it is engineered to receive pings and “listen” without sending out a signal which might reveal their location to an enemy
- Increased use of lower frequency active sonar and non-acoustic methods of detecting.”(Nichols, Hardening US Unmanned Systems Against Enemy Counter Measures, 2019)
What is an Acoustical attack on the UAS Gyroscope?
There are two possibilities: compromising the sound source or drone on drone attack:
Compromising the Sound Source
- UAM with speakers (consider police and military operations or search-and-rescue operations)(Usenix.org, 2019)
- Counter the source of the sound from the speaker with different frequency sound
- Jamming attack aims to generate ultrasonic noises and cause continuing vibration of the membrane on the sensor, which make the measurements impossible
- Level of noise causes performance degradation
Drone on Drone Attack
- Taking a picture of a moving object from UAM
- An adversary drone equipped with a speaker could steer itself toward a victim drone and generate a sound with the resonant frequency of the victim’s gyroscope to drag it down(Usenix.org, 2019)
How has the Long-Range Acoustic Device (LRAD) used as a sonic weapon? (LRAD, 2019)
It has been used primarily for denying GPS navigation:
GPS Denied Navigation
- GPS navigation relies on measuring the distance or delay, to several known transmitters in order to triangulate the mobile receiver’s position
- GPS-denied environment presents navigation challenges for UAV and UAM
- These areas include urban canyons, forest canopy, etc.
- Strike Resonance frequency – which disrupts balance (vehicles tilt, orientation & rotation)
MEMS
What is a MEMS and how does it relate to the UAS gyroscope?
As shown in Figure 19-7 MEMS Gyroscope,
- MEMS (Microelectromechanical-Systems) gyroscopes are located in the rotor systems of most drones
- Visualization of a MEMS gyroscope is a single proof mass suspended above a substrate
- The proof mass is free to oscillate in two perpendicular directions, the drive and sense
(Said Emre Alper, December 2008)
Figure 19-8: MEMS Gyroscope
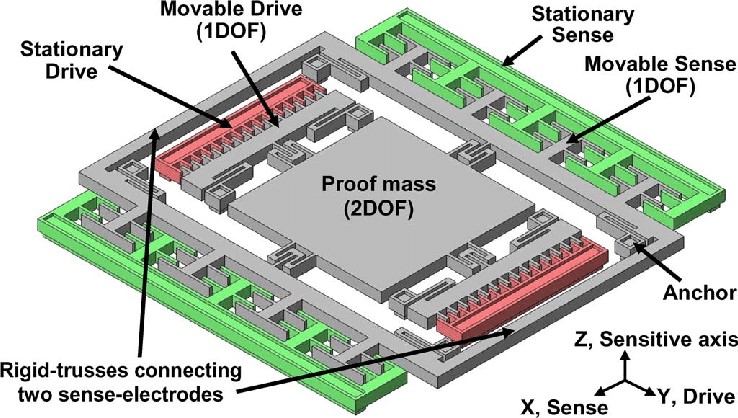
Source: (Said Emre Alper, December 2008)
A very interesting presentation on MEMS is available at (Said Emre Alper, December 2008).
Resonance Effects on MEMS
Achieving resonance frequencies can have a significant effect for countering hostile UAS:
- MEMS Gyroscope can be degraded using harsh acoustic noise
- MEMS Gyroscope has a resonant frequency that is related to the physical characteristics of its structure (Usenix.org, 2019)
- MEMS gyroscopes have resonant frequencies much higher than can be heard (audible and ultrasonic ranges)
- Unexpected resonance output caused from an attack will cause the rotor system to malfunction
- Rotors will spin at differing speeds causing the drone to become unstable and crash
What is Resonance Tuning?
- “In the operation of MEMS gyroscopes, the bending changes the capacitance between the sensing mass and the sensing electrode, and this capacitance change is sensed as the output of the gyroscope
- By using an additional feedback capacitor connected to the sensing electrode, the resonant frequency and the magnitude of the resonance effect can be tuned
- Resonance can be induced by a malicious attacker, if resonant frequencies exist in gyroscopes”(Nichols, Hardening US Unmanned Systems Against Enemy Counter Measures, 2019)
What is the “so what” for Acoustics? Here are the author’s thoughts:
- “Passive detection is much cheaper and cost effective to operate vs a complex radar system for a single installation (limited by detection range ~350ft)
- MEMS gyroscopes contained in rotor systems are very susceptible to malfunction when struck with rough noise that resonates inside the MEMS
- Offensive acoustic systems are currently mounted, could become man portable
- Offensive systems are not detected by National ELINT assets
- Not looking for acoustic energy signatures, enemy can remain hidden from detection when using acoustics.”(Nichols, Hardening US Unmanned Systems Against Enemy Counter Measures, 2019)
Are there Countermeasures for Acoustic attack on Gyroscope?
“Yes, some but not totally effective:
- Physical Isolation – provide physical isolation from the sound noise
- Surrounding the gyroscope with foam would also be a simple and inexpensive countermeasure
- Differential Comparator
- Using an additional gyroscope with a special structure that responds only to the resonant frequency, the application systems can cancel out the resonant output from the main gyroscope
- Detect and cancel out analog sensor input spoofing against CIEDs.”(Nichols, Hardening US Unmanned Systems Against Enemy Counter Measures, 2019)
South Korean experiment
A paper by Yunmonk son, et. Al. From the Korean advanced institute of science and technology (KAIST), in the authors judgement, is the seminal paper on taken down drones using sound noise on gyroscope sensors! (Yunmonk Son, 2015) It is required reading for my students.
(Yunmonk Son, 2015) describes the relationship between Sound Pressure Level (SPL) and Sound Amplitude and derives the attack distance, d as (in dB) :
Eq. 19-6
SPL = SPLref 20 log (A / Aref )
Where SPL = sound pressure level, SPLref is the reference, A and Aref are the amplitudes of the source and reference point. Using the real-world experiments (Yunmonk Son, 2015) found that:
Eq. 19-7
SPL = SPLref – 20 log (d / dref )
Where d, dref are the attack scenario distances.
KAIST under (Yunmonk Son, 2015) primary conclusions are:
- “Many sensing and actuation systems trust their measurements and actuate according to them. Unfortunately, this can lead to security vulnerabilities that cause critically unintended actuations.
- The sound channel can be used as a side channel for MEMS gyroscopes from a security point of view.
- 15 kinds of MEMS gyroscopes were tested, and seven of them were found vulnerable to disruption using intentional noise.
- The output of the vulnerable MEMS gyroscopes was found using a consumer-grade speaker to fluctuate up to dozens of times as a result of the sound noise.
- Authors found that an attacker with only 30% of the amplitude of the maximum sound noise could achieve the same result (disruption) at the same distance.
- At 140 decibels, it would be possible to affect a vulnerable drone up from around 40 meters away,
- Some drone gyroscopes have resonant frequencies in both the audible and ultrasonic frequency ranges, making them vulnerable to interference from intentional sound noise.
- Authors found that accelerometers integrated with MEMS gyroscopes were also affected by high-power sound noise at certain frequencies.”(Yunmonk Son, 2015)[6]
NOISE
Loud and abrupt sound as a countermeasure also brings the problem of exposure and loss. Chapter 17 of (Gelfand S. A., 2009) discusses the effects of noise and hearing conservation. Chapter 20 of (Gelfand S. A., 2009) discusses occupational standards. Safety is an important topic but outside the scope of this writing.
UAS Collaboration – SWARM
Time to wrap-up the chapter. Recall that the authors previously defined in Chapter 3, a UAS SWARM as a uniform mass of undifferentiated individual’s w/o Chief at automation level 4 or 5. SWARMs exhibit the following advantages:
- Efficient based on numbers, emergent large group behaviors, and reactions
- Not controllable or automated, decentralized intelligence
- Think shoal of fish w/ evolving local rules; highly resistant form
- Not changing based on survivability of members, no hierarchy
SWARM Countermeasures include disruption, i.e. changing the Strategic Global View of SWARM (its only real vulnerability), complete Defender collaboration with multiple kinetic and non-kinetic countermeasures, and use of Acoustic Countermeasures for identification as friend or foe (IFF) based on a library of manufacture detection signatures and complete , abrupt rotor disablement by attacking the SWARM units with resonant, loud ( 100-140 dB) sound noise aimed directly at the MEMS gyroscopes or close by on the unit. [Think of glass breaking at resonance frequency or a submarine under depth charge attack. The former breaks by super- excited molecules in the glass and literally shakes apart. The latter is destroyed by violent shaking of the submarine so that its parts break and flooding ensues. It is not necessary to hit the submarine directly because explosions in water, hence sound waves and explosive forces, carry very far and effectively to the target.]
Discussion Questions
1) This chapter explores the use of acoustic countermeasures against UAS. The authors content that every manufactured UAS has unique sound detection signatures. Further these can be libraried and used in a search algorithm to IFF the UAS group or SWARM. At the DoD 7th Annual Summit, (Nichols, Hardening US Unmanned Systems Against Enemy Counter Measures, 2019) the author found that several contractors are actually doing this and building databases. BUT they refuse to share their data because it is proprietary. Assuming this situation cannot be changed, suggest two ways to get around this problem not involving legal actions. What type of research project would you propose to meet an 85% detection criteria that would suffice as an initial IFF database for evaluation?
2) Along with attacking the MEMS gyroscopes to disable the UAS rotor, propose an experiment to use acoustic countermeasures on the UAS internals, such as SCADA, payload, navigation, internal clocks, internal computer, battery, etc. Perhaps loud noise can disrupt additional UAS features?
3) This chapter has discussed sound in the in the extended hearing ranges from 10 Hz to 20,000 Hz. Many UAS are designed for higher frequencies, i.e. ultrasonic and hypersonic. Propose an experiment to test sound disruption effects at the higher frequencies. (Drones, 2017) Quad Star Drones has some interesting “takes” on hypersonic flight and Mach 0.8 speeds.
Bibliography
Adamy, D. -0. (2015). EW 104 EW against a New Generation of Threats. Boston: Artech House.
Adamy, D. (2001). EW 101 A First Course in Electronic Warfare. Boston, MA: Artech House.
Adamy, D.-9. (1998, Jan). Lesson 4: the basic link for all EW functions. (electronic warfare)(EW Reference & Source Guide). Journal of Electronic Defense, Jan 1998 Issue.
Administrator. (2015, June 15). Standing Wave and Fundamental Frequency. Retrieved from Electronics Hub: https://www.electronicshub.org/?s=fundamental frequency
Austin, R. (2010). “Design for Stealth”, Unmanned Aircraft Systems UAVS Design Development and Deployment. New York: John Wiley and Sons.
Burch, D. (2015). RADAR for Mariners. New York: McGraw-Hill.
Carter, A. (2012, May 24) EEWeb. Retrieved from https://www.eeweb.com/profile/andrew-carter/articles/the-sound-intensity on 16 July 2019.
Drones, Q. S. (2017, July 11). quadcopters-have-hit-the-sound-barrier/. Retrieved from quadstardrones.com: https://quadstardrones.com/2017/07/11/quadcopters-have-hit-the-sound-barrier/
Entokey, a. G. (2019, May 16). entokey.com/acoustics-and-sound-measurement/. Retrieved from entokey.com/acoustics-and-sound-measurement/: https://entokey.com/acoustics-and-sound-measurement/
Gelfand. (2004). “Physical Concepts”, Hearing an Introduction to Psychological and Physiological Acoustics, 4th ed. New York City.
Gelfand, S. A. (2009). Essentials of Audiology, 3rd Edition. Stuttgart, DE: Thieme.
Heinman, C. (2019). Hearing Loss Tests Patrient D v-105. Carlisle, PA: Brown Optical Hearing Aid Service.
Hubbard, R. K. (1998). Boater’s Bowditch. Camden, MA: International Marine.
Kirk, J. (2015, August 5). sounds-can-knock-drones-sky. Retrieved from www.computerworld.com.au/article/581231: https://www.computerworld.com.au/article/581231/sounds-can-knock-drones-sky/
LRAD. (2019, May 189). LRAD 450XL Datasheet. Retrieved from LRADX: http://www.lradx.com/wp-context/uploads/2015/05/LRAD_datasheet_450XL.pdf
Merriam-Webster. (2019, May 17). Merriam-Webster Online Dictionary.
Monahan, K. (2004). The Radar Book: Effective Navigation and Collision Avoidance. Anacortes, WA: Fine Edge Publications.
Nichols, R. K. (1996). Classical Cryptography Course, Volume I. Laguna Hills, CA: Aegean Park Press.
Nichols, R. K. (2019, March 14). Hardening US Unmanned Systems Against Enemy Counter Measures. 7th Annual Unmanned Systems Summit. Alexandria, VA, USA: PPTX presentation , self.
Pierson. (2019, May 16). tuning-fork-waves-sound. Retrieved from airfreshener.club – Pierson Education: https://airfreshener.club/quotes/tuning-fork-waves-sound.html
Said Emre Alper, Y. T. (December 2008). Compact Angular Rate Sensor System Using a Fully Decoupled Silicon-on-Glass MEMS Gyroscope. JOURNAL OF MICROELECTROMECHANICAL SYSTEMS, VOL. 17, NO. 6.
Signia. (2019, May 16). Signia Hearing Aids. Retrieved from Signia Hearing Aids – Hear across America: www.signiausa.com
Staff. (2016, April 17). Equal Loudness Contours. Retrieved from Gutenberg Organization: http://central.gutenberg.org/article/WHEBN0001046687/Equal-loudness contour
Studios, D. D. (2017). Boaters Ref. USA.
Toomay, J. (1982). RADAR for the Non – Specialist. London; Lifetime Learning Publications. London: Lifetime Learning Publications.
TRS, S. (2018, July 10). Tontechnik-Rechner-Sengpielaudio. Retrieved from Tontechnik-Rechner-Sengpielaudio Calculator: www.sengspielaudio.com/calculator-wavelength.htm
Uni-wuppertal. (2019, May 15). Inverse Square Law, General. Retrieved from hydrogen.physik.uni-wuppertal.de/hyperphysics/: http://hydrogen.physik.uni-wuppertal.de/hyperphysics/hyperphysics/hbase/forces/isq.html
Usenix.org. (2019, 6 9). MEMS, Drones, & Sound Sourcing. Retrieved from Usenix.org: www.usenix.org
Weise, E. (2017, August 23). could-hackers-behind-u-s-navy-collisions. Retrieved from USATODAY: https://www.ruidosonews.com/story/tech/news/2017/08/23/could-hackers-behind-u-s-navy-collisions/594107001/
Yunmonk Son, H. S. (2015, August 12-14). Rocking Drones with Intentional Sound Noise on Gyroscopic Sensors. Proc. 24th Usenix Security Symposium. Washington, DC: USENIX. Retrieved from https://www.usenix.org/conference/usenixsecurity15/technical-sessions/presentation/son
Readings
Adamy, D. (2001) EW 101 A First Course in Electronic Warfare, Boston: Artech House.
Adamy, D. (2004) EW 102 A Second Course in Electronic Warfare, Boston: Artech House.
Adamy, D. (2009) EW 103 Tactical Battlefield Communications Electronic Warfare, Boston: Artech House.
Adamy, D. (2015) EW 104 EW against a New Generation of Threats, Boston: Artech House.
Adamy, D. (2003) Introduction to Electronic Warfare Modelling and Simulation, Boston: Artech House.
Austin, R. (2010) UAVS Design, Development and Deployment, New York: Wiley.
Hubbard, R.K (1998) Boater’s Bowditch, Camden, MA: International Marine.
Burch, D. (2005) RADAR for Mariners. New York, McGraw-Hill.
Monahan, K (2004) The RADAR Book: Effective Navigation and Collision Avoidance. Anacortes, WA: Fine edge Publications.
Toomay, J.C. (1982) RADAR for the Non – Specialist. London; Lifetime Learning Publications
- 3 dB is an interesting cutoff datum. Because decibels are logarithmic and the log (base 10) of 3 =).477 ≈ 50% power. So, 3 decibel cutoff is where the power drops by approximately half. 3 dB implies ½ of the power. An increase of 3dB doubles the sound intensity but a 10-dB increase is required before sound is perceived to be twice as loud. A small increase in decibels represents a large increase in intensity. For example, 10 dB is 10x more intense than 1 dB, while 20 dB is 100x more intense than 1 dB. (Adamy D. , 2001) ↵
- It is left to the reader to obtain any standard trigonometry text to see all the parameters of the well-known sine wave. ↵
- Anechoic means free from echo. An anechoic chamber provides a non-reflective, non-echoing, echo-free room designed to completely absorb reflections of either sound or electromagnetic waves. They are also isolated from waves entering from their surroundings. Sound interactions / countermeasures for UAS testing are ideally done in an anechoic chamber. NASA Langley has a fully equipped room in Va. Patient D v-105 was only able to hear sounds entering his / her ears by headset connected to an audiometer. The audiometer is a machine that evaluates hearing acuity. The patient responds to test frequencies and sounds by pushing a red feedback button. ↵
- HIPPA Privacy Act releases signed. ↵
- LRAD is a Long-Range Acoustic Device (weapon). It was discussed in detail in Chapter 8. “The 450XL model (LRAD, 2019) can produce 140 dB at 1m which is equivalent to 108.5 dB at 37.58 m.” (Yunmonk Son, 2015) ↵
- Author note: although not specified in (Yunmonk Son, 2015), according to chapter author research and experimentation, the frequencies turn out to be the resonance frequencies. So agrees Dr. Kim at KAIST. “You would think that the gyroscopes used in unmanned aircraft systems (UAS) would have been designed to have resonant frequencies above the audible spectrum – i.e., above 20 kHz – but Kim and his team found that some have not.” (Yunmonk Son, 2015) In the case of a gyroscope, “you can get it to spit out very strange outputs, as researcher Yongdae Kim, a professor in the electrical engineering department of the Korea Advanced Institute of Science and Technology (KAIST), told ComputerWorld” (Kirk, 2015) An example of resonance frequency and breaking glass can be found on youtu.be at https://youtu.be/BE827gwnnk4 ↵
