17 Modern Approaches for Sorghum Breeding in Mali
Abstract
Sorghum is an important and versatile food crop in the Sudan savannah environments of West Africa. Sorghum production doubled in the last 20 years and its yield remained stable and low in Mali. Molecular markers were used to dissect quantitative variation to increase efficiency of breeding programs. From 2009–2014, marker-assisted recurrent selection (MARS), an integrated process to identify favorable alleles and to monitor their pyramiding throughout the breeding course, was implemented. Two large bi-parental populations derived from complementary recent elite inbreds, Tiandougou, Keninkeni, and Lata-3, were developed to improve grain yield productivity and stability while maintaining traditional food processing quality. Populations were phenotyped multi-locally. Quantitative Trait Loci (QTL) analyses identified, in each genomic region, the most favorable morphologic, yield components, grain quality, and flowering time parental alleles. Marker-assisted recurrent selection approach is detailed for one of the populations. Several genotypic ideotypes corresponding to ideal recombination patterns between the parents were defined. Molecular marker-guided recurrent crossing allowed favorable QTL accumulation for a large range of traits. Three marker-assisted recurrent selection cycles were accomplished. Four stable and superior elite lines were identified, leading to their registration in 2018 in national and ECOWAS (Economic Community of West African States) catalogs.
Keywords: sorghum, marker assisted selection, photoperiod, Sahel
Introduction
Sorghum (Sorghum bicolor) is one of the most important staple crops in West Africa, especially in the Guinea and Sudan savannah environments. Sorghum production in West Africa doubled from 1980 to 2008 because of the increase in cultivated areas although the yield remained stable and low. Past breeding efforts on sorghum in West Africa, starting in the sixties, were essentially on increasing the harvest index by developing photoperiod insensitive varieties and reducing plant height and tiller number. However, this approach showed limited positive impact mainly because making the sorghum photoperiod insensitive removed a key component of adaptation to climatic conditions and cultural practices of the target environments (Kouressy et al., 2008a). Furthermore, new varieties showed poor grain quality because of unsuitable biochemical and physical properties or sensitivity to grain weathering. Recent approaches aim to maintain rusticity traits and grain quality of local cultivars (Vaksmann et al., 2008) with improved yield potential to support intensification.
This breeding strategy is particularly adapted to the Malian southern zone (>800 mm of annual rainfall) where better soil fertility, due to cotton cultivation, allows new sorghum varieties to express their yield potential. However, in the center zone of Mali (≥500 mm) where sorghum crop faces more severe drought constraints, early maturing varieties with a low level of photoperiod sensitivity are the main focus of breeders.
Sorghum has a wide range of use in food and feed industries, as well as in alcohol and renewable energy production. In Africa, particularly in Mali, sorghum is mainly used in traditional food and beverage (processing of main meals and traditional beer). Improved varieties are not widely adopted by end users mainly because of the poor seed quality. In Mali, one of the main traditional dishes prepared from sorghum flour is Tô, a thick porridge. The characteristics of a good Tô are firmness and retention of its firmness, water, color, and taste while stored at night. Biochemical and physical characteristics of grain and their interactions determine its quality for end users (Fliedel, 1995).
Molecular markers are useful tools to dissect highly polygenic traits into QTL, providing a way to improve breeding efficiency of polygenic traits. During the past 20 years, QTL studies have often relied on using segregating populations suitable for repeated or multi-environment characterization. However, such populations have the drawback of generally being disconnected from breeding materials because of the time needed to develop them. For this reason, QTL detected in such experimental populations are often not transferable and not applicable in breeding populations. On the contrary, QTL analyses that are integrated to the breeding process and specifically designed for target crosses should provide applicable tools to improve breeding efficiency.
Marker-assisted recurrent selection (MARS) has been proposed as an integrated process of breeding and detection of QTL of interest. In such approaches, molecular markers are used to identify key QTL involved in target traits and environments and to monitor and pyramid favorable alleles in subsequent generations through progenies crossing. The ideal genotype that can be obtained from a bi-parental cross can is a mosaic of chromosomal segments carrying favorable alleles from both parents.
MARS schemes involve several successive generations of crossing of superior individuals, based on their molecular marker genotypes, and the use of multi-trait selection indices. This approach could enable the achievement of an ideal genotype, which is unlikely to be realized with a classical breeding process within a population of realistic size (Peleman & van der Voort, 2003). The added value of using molecular markers is to track recombination towards the breeder’s ideotypes and allow simultaneous detection of QTL for all traits that need consideration. QTL analysis can also be assessed in different environments to provide a basis for Genotype by Environment (GxE) interpretation.
For now, only a few examples have been published on the application of the MARS approach (Beyene et al., 2016; Eathington et al., 2007; Johnson, 2003; Rahman et al., 2020), and to our knowledge, its use on African sorghum has not been reported. However, the MARS approach has been successfully applied by the private sector, especially in maize (Ribaut & Ragot, 2007).
Integration of molecular markers requires significant modification in the organization of a breeding program, which becomes a more complex decision-making process involving more data analysis in a shorter timeframe. For this reason, the successful application of this approach must rely on a tight interaction between breeders, genotyping services, and geneticists in charge of data analysis and crossing schemes development.
Between 2008 and 2014, as part of the Generation Challenge Programme (GCP), a project called “Improving sorghum productivity in semi-arid environments of Mali through integrated MARS” was implemented within the national breeding program of Institut d’Economie Rurale (IER) with the collaboration of Syngenta and the Centre de coopération Internationale en Recherche Agronomique pour le Développement (CIRAD). This chapter summarizes the results obtained from that project and reflects on lessons learned from implementing marker-assisted and ideotype-driven selection in a national breeding program. Prospects for accelerating sorghum breeding under climate uncertainties and with better precision are also highlighted.
Population Development
1. Parents’ Choice
The breeding product targeted an improved grain yield (>2 t/ha), photoperiod sensitivity that provides adaptation to local production environment, and acceptable grain quality for traditional food preparation. Three varieties were used as parents for the development of new breeding populations based on their complementary attributes. The first two varieties, Tiandougou and Keninkeni, were elite varieties from the IER breeding program, while Lata-3 was an improved variety from the International Crops Research Institute for the Semi-Arid Tropics (ICRISAT). Tiandougou is a Caudatum type with a thick pericarp, large seed size, and chalky grains, while Keninkeni and Lata-3 are Guinea botanical types with a thin and glassy pericarp (vitreous endosperm) and medium seed size. The three parents are medium height (< 200 cm), well adapted to the Sudano-sahelian conditions, and photoperiod sensitive. From sowing to grain’s physiological maturity, Tiandougou is slightly later (127 days) than Keninkeni and Lata-3 (120 days). Two populations, Tiandougou by Keninkeni (P114) and Tiandougou by Lata-3 (P118), were selected to pursue the recurrent cycle selection.
2. Crossing and Population Development
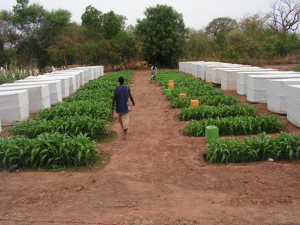
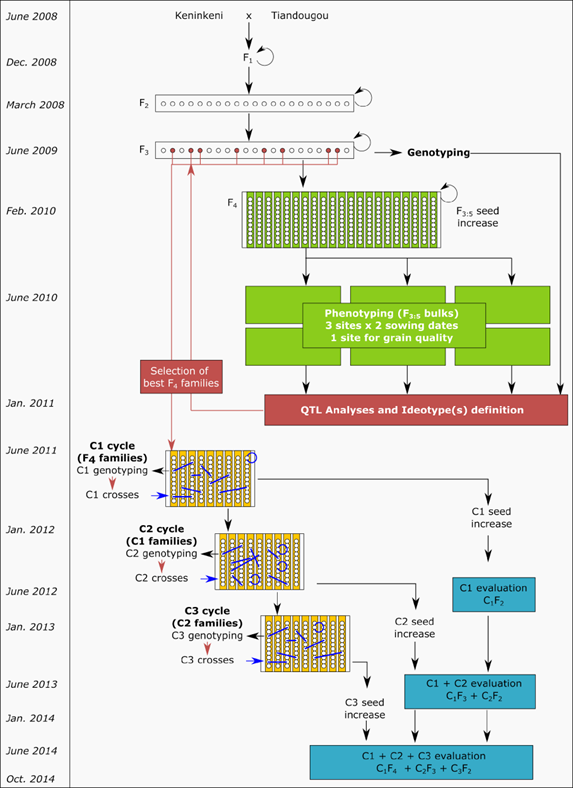
Hand emasculation was performed among varieties during the 2008 rainy season to generate F1 seeds. During the crosses, male and female individual plants used in each cross were self-pollinated. The different crosses were harvested and sown during the first off-season (2008–2009) to produce F2 seeds. Parental conformity and genetic variability tests were performed in an off-season F2 production nursery on each F1 plant and parental seed lot using molecular markers. The systematic control of F1 plants allowed the identification and avoidance of several issues like self-pollinations or non-conformity to the expected cross. Thanks to this quality control, unique F1 plants identified as conforming to the parents were selected to develop the F2 generation, which ensured perfect homogeneity of the populations. The F3 seeds were then produced during the same off-season (See Figure 1). The two populations, each made up of more than 400 F3 families, were evaluated in the field in the 2009 cropping season. Rows of 10 F3 individuals per family were planted in 2009 and a single F3 plant was randomly taken in each row. Ten F4 plants per family were then sown in the 2009 -2010 off-season, selfed, and bulked, leading to a total of 400 F4:5 bulk family seeds, which were used for multi-location phenotyping experiments in the 2010 cropping season.
Figure 1
Field Phenotyping
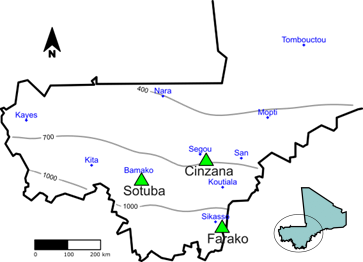
Multi-location phenotyping experiments were conducted during the cropping season, in 2010 for P114 and in 2011 for P118. Three experimental research stations were identified (See Figure 2) as having reliable and homogeneous field conditions to allow large populations phenotyping: Cinzana station (13°15′N, 5°58′E W, 265 m; Sudano-sahelian savannah), Sotuba station (12°39′N, 7°56W, 381 m; Sudano-sahelian savannah), and Farako station (11°13′N, 5°29′W, 375 m; Sudano-Guinean savannah). The three stations cover the main sorghum production areas in Mali. All three sites have a mono-modal pattern of rainfall in summer (May to November), accounting on average for 690 mm at Cinzana, 890 mm at Sotuba, and 1,060 mm at Farako. Average maximal/minimal monthly temperatures were 35.6 °C/19.3 °C at Cinzana, 34.7 °C/20.6 °C at Sotuba, and 33.7 °C/21.0 °C at Farako.
In order to increase the number of environmental conditions, phenotyping was conducted at two different sowing dates in each location. Each population was thus phenotyped in six environments. In Sotuba, a late sowing in October was conducted to complete a photoperiod-sensitivity study of the progenies. Each population was thus observed in long and intermediate day length (usual cropping season, sowing 19 June and 15 July 2011) and short-day length (off-season, sowing 3 October 2011). Maximum astronomical day length is 12.78 h at Cinzana, 12.75 h at Sotuba, and 12.66 h at Farako.
Figure 2
Experimental layouts for each population followed an augmented design. For P114, there were 447 entries with 2 rows of 4m per entry (spacing within rows: 0.4 m; spacing between rows: 0.75 m), 20 hills per plot, and 2 plants per hill. Each trial included a single replication of 401 progenies plus the two parental lines, used as checks (23 entries of each parent) regularly included in the design to control field heterogeneity. For P118 there were 464 entries with 29 blocks of 16 entries (14 progeny and 2 parents used as checks) with the same spacing and thinning as the P114. Traits recorded in the different locations were grain yield, yield components, flowering date, plant height, and panicle morphology. Some other traits, such as lodging, disease, and bird damage were recorded when relevant.
Grain quality was phenotyped in both populations using grain samples from a single environment that was selected after harvest based on the overall quality of the harvested grain (Guindo, 2016). The grain samples collected after harvest were analyzed in the agroclimatology laboratory of IER. Dehulling yield, the ratio of dehulled grain weight to total grain was measured. A mini-Tô was prepared from dehulled grain in the Food Technology Laboratory (LTA) of IER on which Tô consistency and Tô color were measured. In addition, a sample of harvested grain was sent to CIRAD, France where Near Infrared Spectroscopy (NIRS) analyses were performed on whole grain to obtain predictions for the total content of grain proteins, lipids, and amylose (Guindo et al., 2016). Endosperm texture and pericarp thickness were also measured by visual examination of grains. Finally, image analysis was conducted on a sample of grains to determine grain shape and color.
Genetic Maps Construction
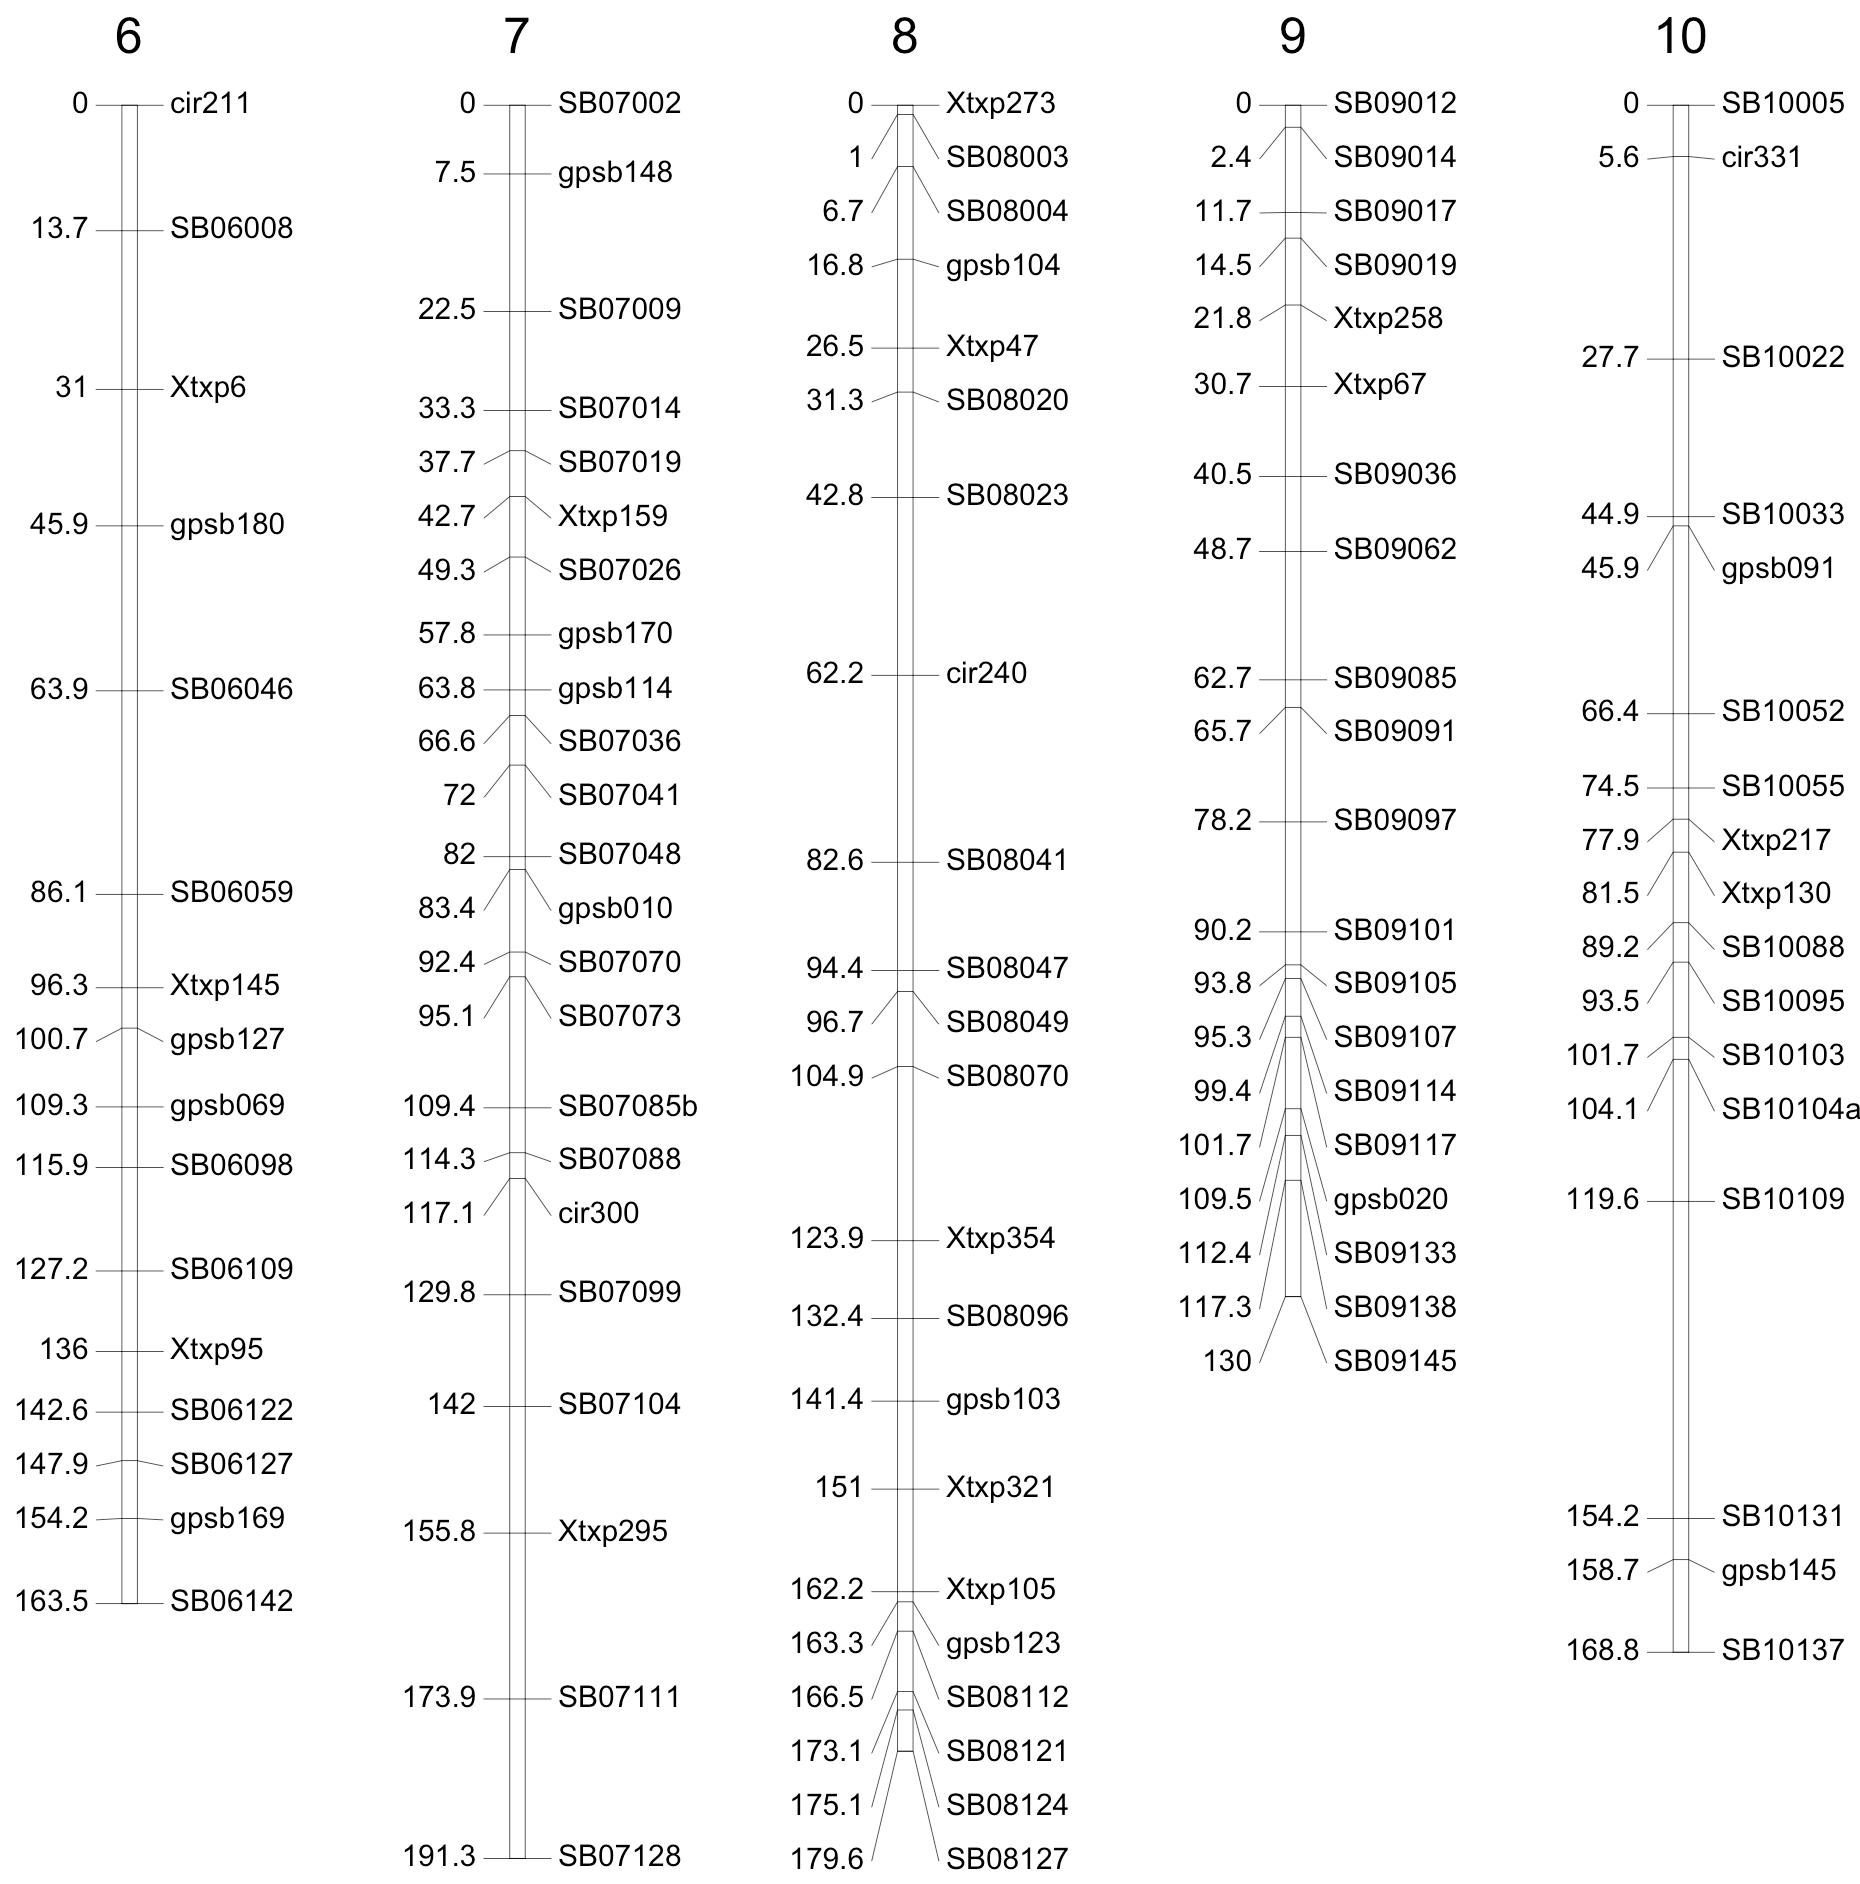
Genotyping of P114 was completed in 2009/2010. DNA was produced from a bulk of 10 F4 individuals from each F3 family grown in the greenhouse at Montpellier. At the beginning of the project, and until 2010, single nucleotide polymorphism (SNP) markers were not commonly used in sorghum. A set of 79 simple-sequence repeat (SSR) markers was thus used at the early stages of the project for population construction. This map was then completed with SNP markers using the SNP information available in early 2010. A first experiment, using Illumina technology, was carried out using an array of 384 markers. Genotyping of the population was finally completed with an additional experiment using 100 well-distributed Kasp SNPs developed by the Integrated Breeding Platform (https://www.integratedbreeding.net/45/products-catalogue?id=330). A map using the most informative markers was derived with a total number of 200 loci (124 SNP, 76 SSR) (See Figure 3) that spanned a total genetic distance of 1,793 cM and was used for QTL detection.
Genotyping of P118 was carried out in early 2012. DNA extracts were produced from bulks of F4 individual plants sampled from each family during seed multiplication in Sotuba in 2010. A total of 236 Kasp SNP markers were analyzed on 401 F3 individuals. The genetic map was constructed from 224 reliable markers, spanning a total genetic distance of 1,340 cM.
Figure 3
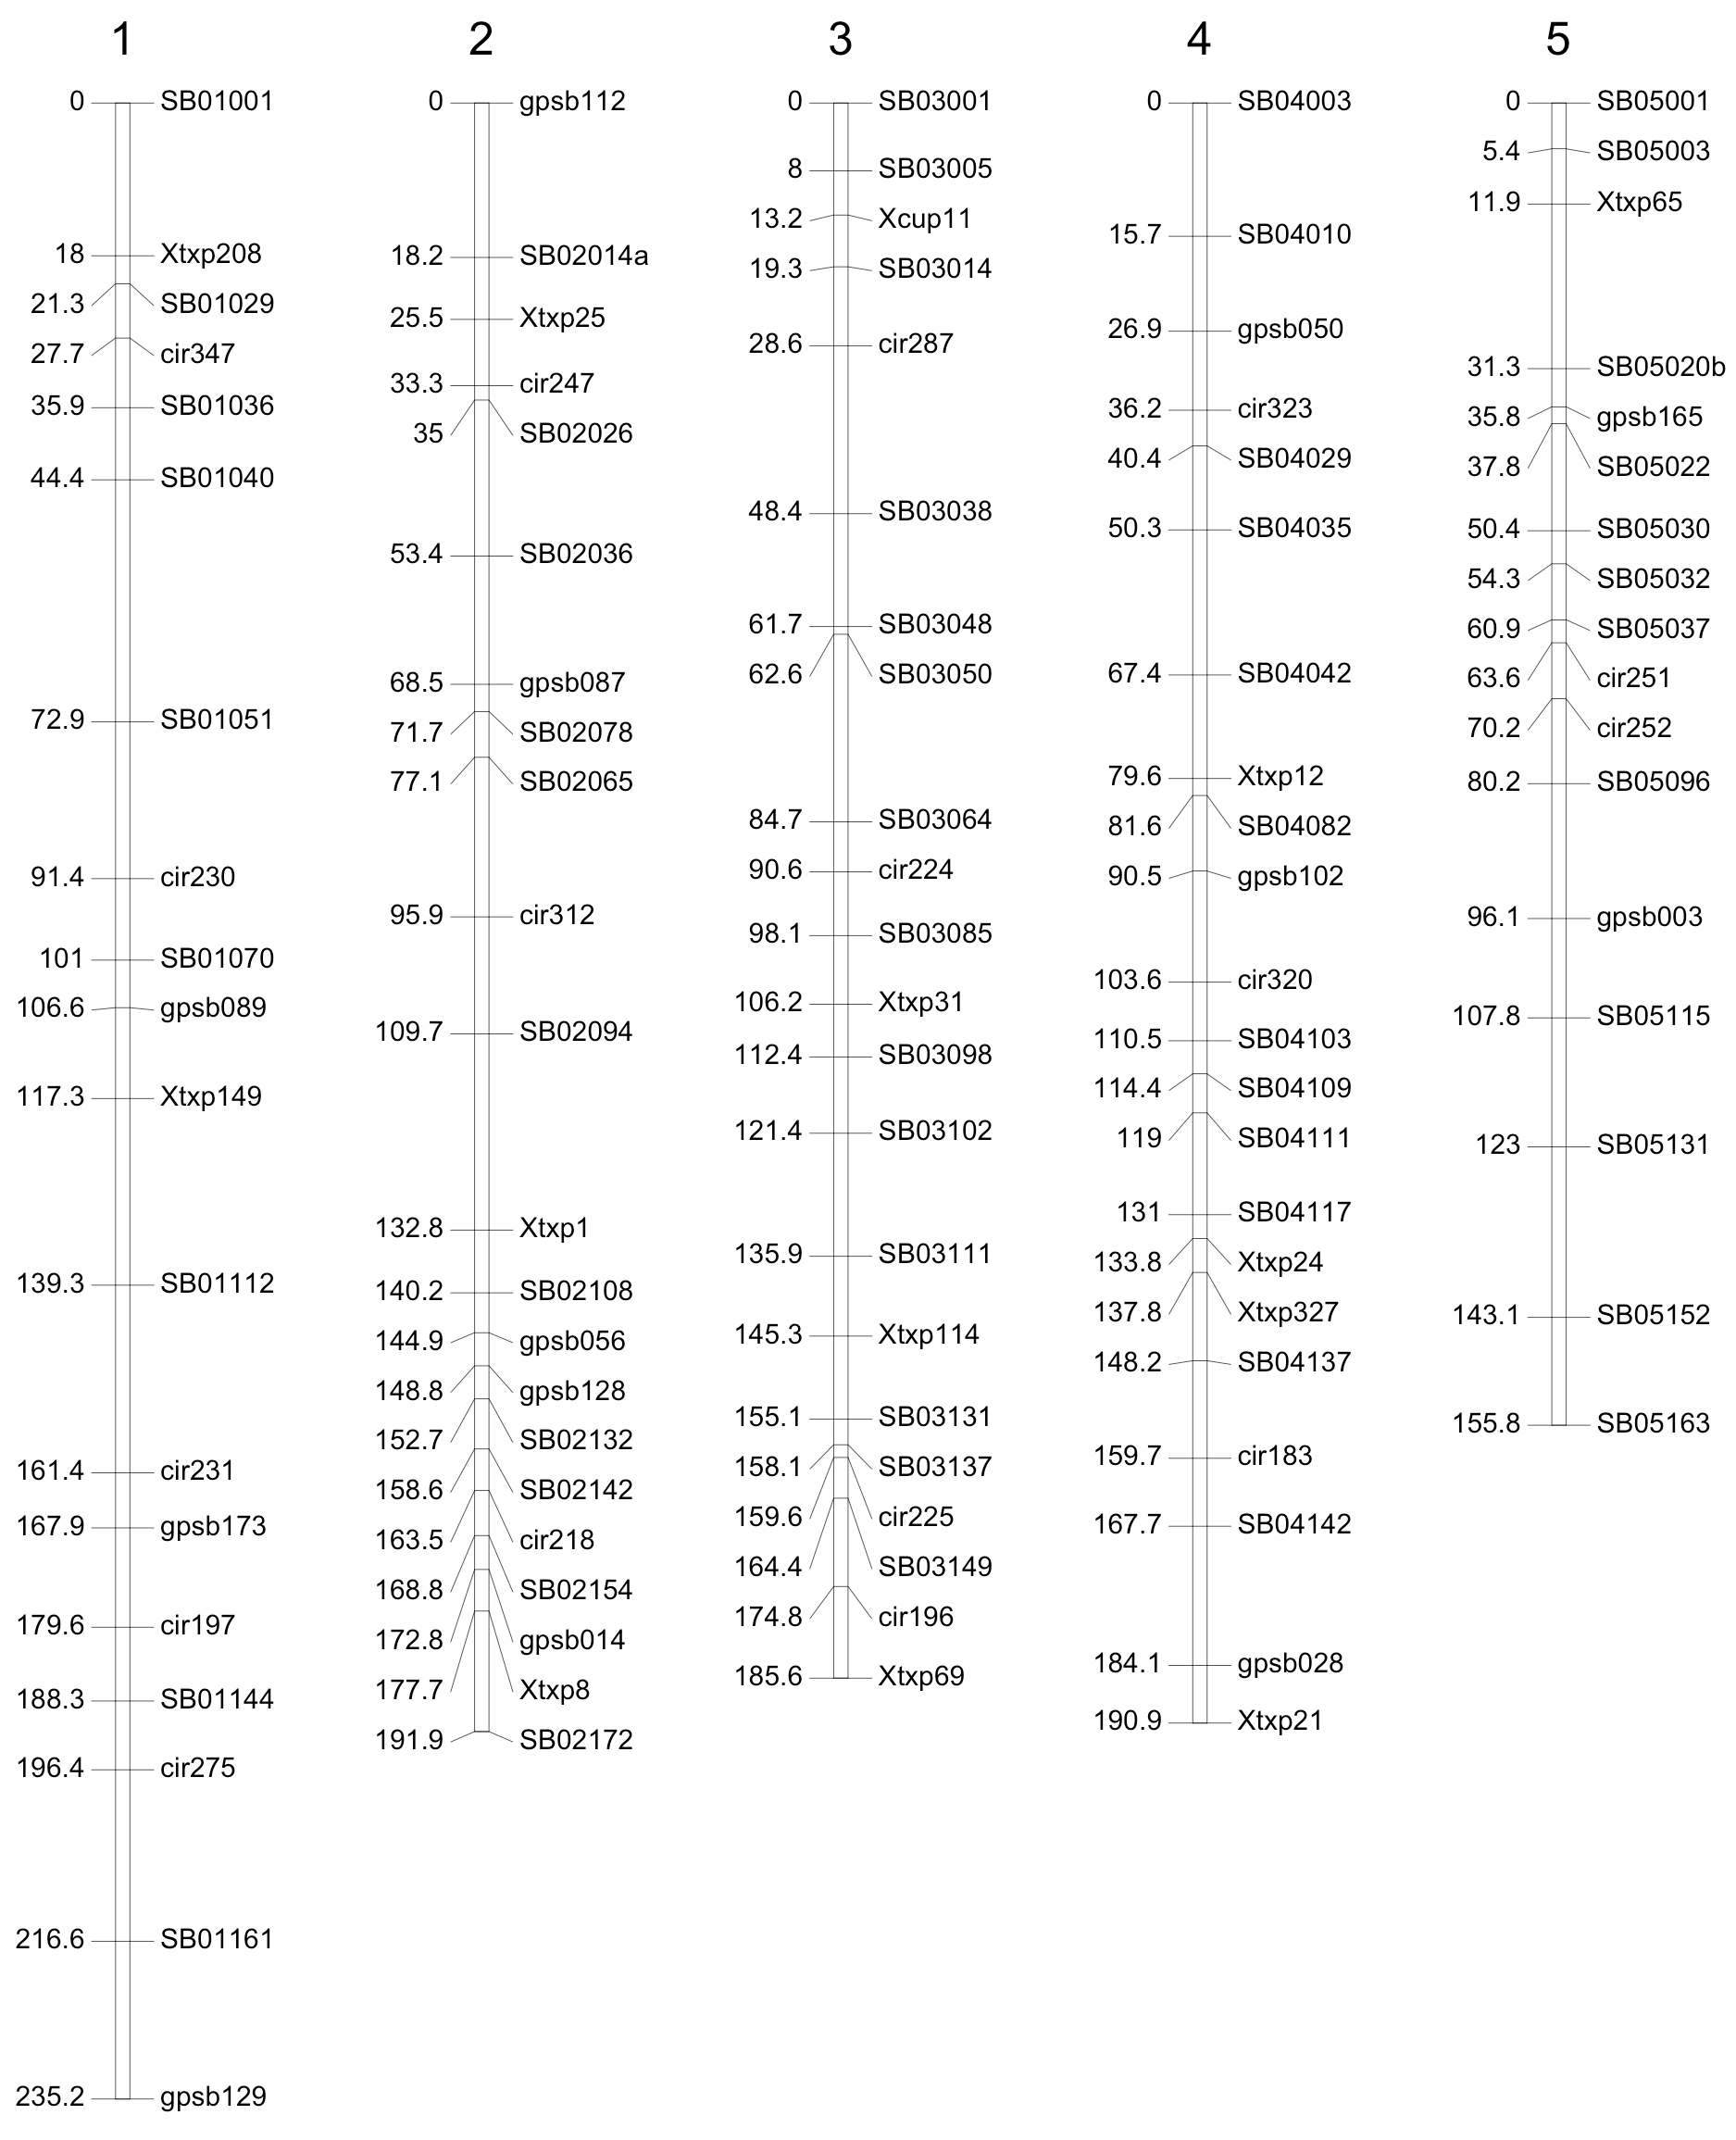
Figure 3 Continued
Genetic Analysis
QTL analyses and modeling were conducted for all traits available across environments. For a given trait, independent QTL analyses were conducted in separate environments. QTL analyses were conducted using composite interval mapping with QTL Cartographer software (Basten et al., 2002). Several hundred QTL were globally detected for all traits in all environments to identify the most favorable parental allele in each region of the genome and to define several genotypic ideotypes to achieve breeding objectives. Grain productivity was one of the main targeted traits, and the QTL detection allowed for the identification of several genomic regions that were involved in grain productivity and for the assessment of QTL effects’ stability across the six environments. In addition, the genetic analysis performed in this context allowed the deciphering of relationships between traits and between environments, breaking possible antagonisms between traits, testing different hypotheses, and designing several ideotypes for various objectives or environments.
1. Large-effect QTL
Some major QTL with large effects have been detected in both populations for pericarp thickness, flowering date, plant anthocyanin (Guindo et al. 2019), and plant height (See Table 1):
- A major QTL for pericarp thickness, corresponding to the Z gene (Ayyangar, 1934), was located on chromosome 2 for which both guinea parents brought the Z (thin) allele.
- A major QTL for flowering date was detected on chromosome 3. In both populations, the allele brought by a Tiandougou parent on this QTL was responsible for later flowering (8 days on average).
- A major QTL for plant anthocyanin corresponding to the P gene (Ayyangar et al., 1933) was detected on chromosome 6 for which Tiandougou brought the recessive p (tan) allele.
- Finally, a major QTL for plant height was detected on chromosome 7, identified as the dwarfing gene Dw3 (Karper, 1932). Both guinea parents, Lata3 and Keninkeni, brought the Dw (tall) allele.
| Trait | Known Gene | Chrom | Effect | Target Allele | ||
| P114 | P118 | P114 | P118 | |||
| Pericarp thickness | Z | 2 | KK thin | Lata thin | KK | Lata |
| Flowering date | 3 | Tian late | Tian late | Tian | – | |
| Anthocyanin | P | 6 | Tian Tan | Tian tan | Tian | Tian |
| Plant Height | Dw3 | 7 | KK tall | Lata tall | KK | Lata |
Grain yield and quality are closely related to flowering date because flowering is a complex trait that controls adaptation of the plant to its environment. In West Africa, most local sorghum varieties are photoperiodic short-day plants. The photoperiod sensitivity constitutes sorghum’s main adaptation factor to climate and parasitic constraints in the Sahel zone (Kouressy et al., 2008b). Grouping flowering at the end of the rainy season ensures a balance between satisfaction of water needs and avoidance of many biotic constraints. Grain of early photoperiod insensitive maturing varieties is attacked by birds and altered by mold and insect complexes, while photoperiod sensitive and late varieties deplete soil moisture before the end of grain filling and escape their seeds’ alteration. The reintroduction of photoperiodism in breeding programs in Mali is recent and plays a key role in sorghum improvement success in the Sahelian zone.
A major QTL for flowering time detected on chromosome 3 was only expressed under long day conditions, showing that it was related to photoperiod sensitivity. The allele brought by the Tiandougou parent was responsible for later flowering (8 days on average). These results were investigated further using a crop modeling approach (Guitton et al., 2018). The different parameters of the Crop Environmental Resource Synthesis (CERES) model corresponded to different chromosomal regions. The major QTL was related to the critical photoperiod parameter (P2O) of the CERES model, that represents, for a given genotype, the value of photoperiod under which the duration of the vegetative stage is constant. Knowledge of genetic control of flowering time now allows breeders to develop varieties specifically adapted to different Sudano-sahelian target environments. Specifically, the modification of the critical photoperiod allowed for modification of the vegetative duration phase while preserving photoperiod sensitivity.
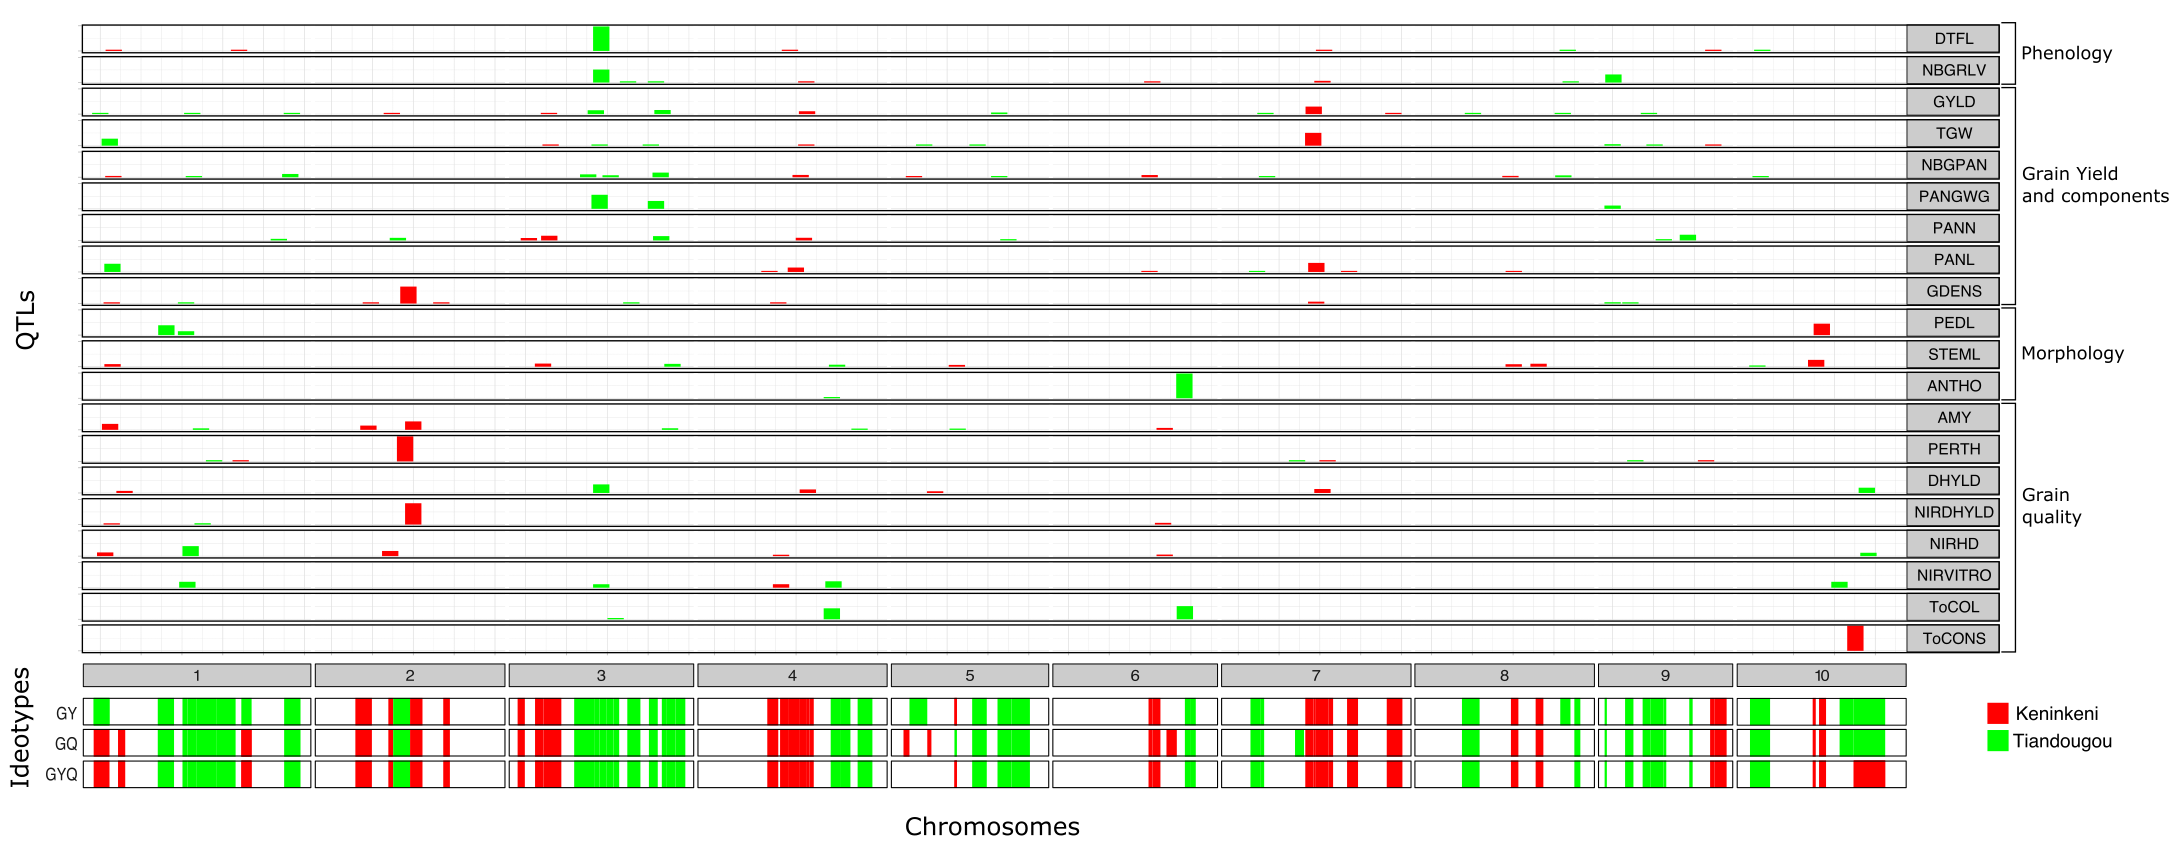
Ideotype Construction
QTL results were translated into genotypic ideotypes, which represent the target parental allele all along the genome that brings favorable contributions for key QTL. In each marker interval, the respective contributions of each parent were compared for all detected QTL, taking into consideration the effects of the QTL and the breeding objectives.
There were some trade-offs to be made that involved the large QTL effects (See Table 1). First, for the major QTL involved in pericarp thickness, the Z (thin) allele was selected as the target allele for both populations. Second, the large effect QTL involved in flowering time and critical photoperiod affected grain productivity, depending on the environment and the genetic background. In P114, late flowering was associated with a QTL for grain yield in all environments, and the late allele (Tiandougou) was selected as the target allele in this population. In P118, the late-flowering allele was also associated with a QTL for grain yield but only in the Farako location; the early flowering allele was associated with a major QTL for grain yield in the Sotuba and Cinzana locations. Two ideotypes were thus derived for both environments differing only on this major flowering time QTL. Third, on the P locus involved in plant anthocyanin, the p (tan) allele was the target allele for selection. Indeed, tan plants (no anthocyanin) are preferred because they generally produce whiter flour and whiter Tô.
Next, the major QTL for plant height was detected on chromosome 7 and identified as the Dw3 gene. Although the overall objective, in terms of plant height, was medium, the tall allele was selected in this region for both populations because it was associated with a QTL for panicle length and consequently with a QTL for grain yield. To compensate for the effect of this QTL on plant height, alleles that contributed to reducing plant height on all other QTL in the rest of the genome were selected (11 and 16 QTL detected in P118 and P114, respectively).
Finally, using only P114 as an example, three different genotypic ideotypes (See Figure 4) were defined. The overall objective was to combine grain productivity (as defined by grain yield and yield components) and grain quality (vitreous endosperm, high amylose, and good Tô properties) with a medium plant height, a thin pericarp, and non-anthocyanin plants. A grain yield (GY) ideotype was constructed that gave priority to grain yield when a conflict was observed in any region between grain yield and grain quality. Additionally, a grain quality (GQ) ideotype was constructed that gave priority to grain quality. Lastly, a third ideotype (GYQ) tried to balance the contributions of both grain yield and grain quality.
Figure 4
QTL Pyramiding by Recurrent Selection
Cycles of three recurrent selection processes of P114, conducted from September 2011 to March 2013, were achieved (See Figure 5). At each cycle, approximately 700 plants were genotyped on the flanking markers of QTL that were included in genotypic ideotypes. Genotypic data were first analyzed to check for consistency across generations and to track pedigree errors from one cycle to the next. From the genotypic data produced at each cycle, genetic values were computed for all possible crosses between all available plants. The genetic values were computed for several QTL indices and for different ideotypes. All computations were performed by Syngenta (Toulouse, France) using proprietary software. A list of best candidate crosses was determined from these genetic values.
Each single selection cycle represented a great challenge because all operations (i.e., leaf sampling, DNA extraction, genotyping, and data analysis) needed completion before flowering. This required a harmonization of field, laboratory, and geneticist teams’ efforts.
Figure 5
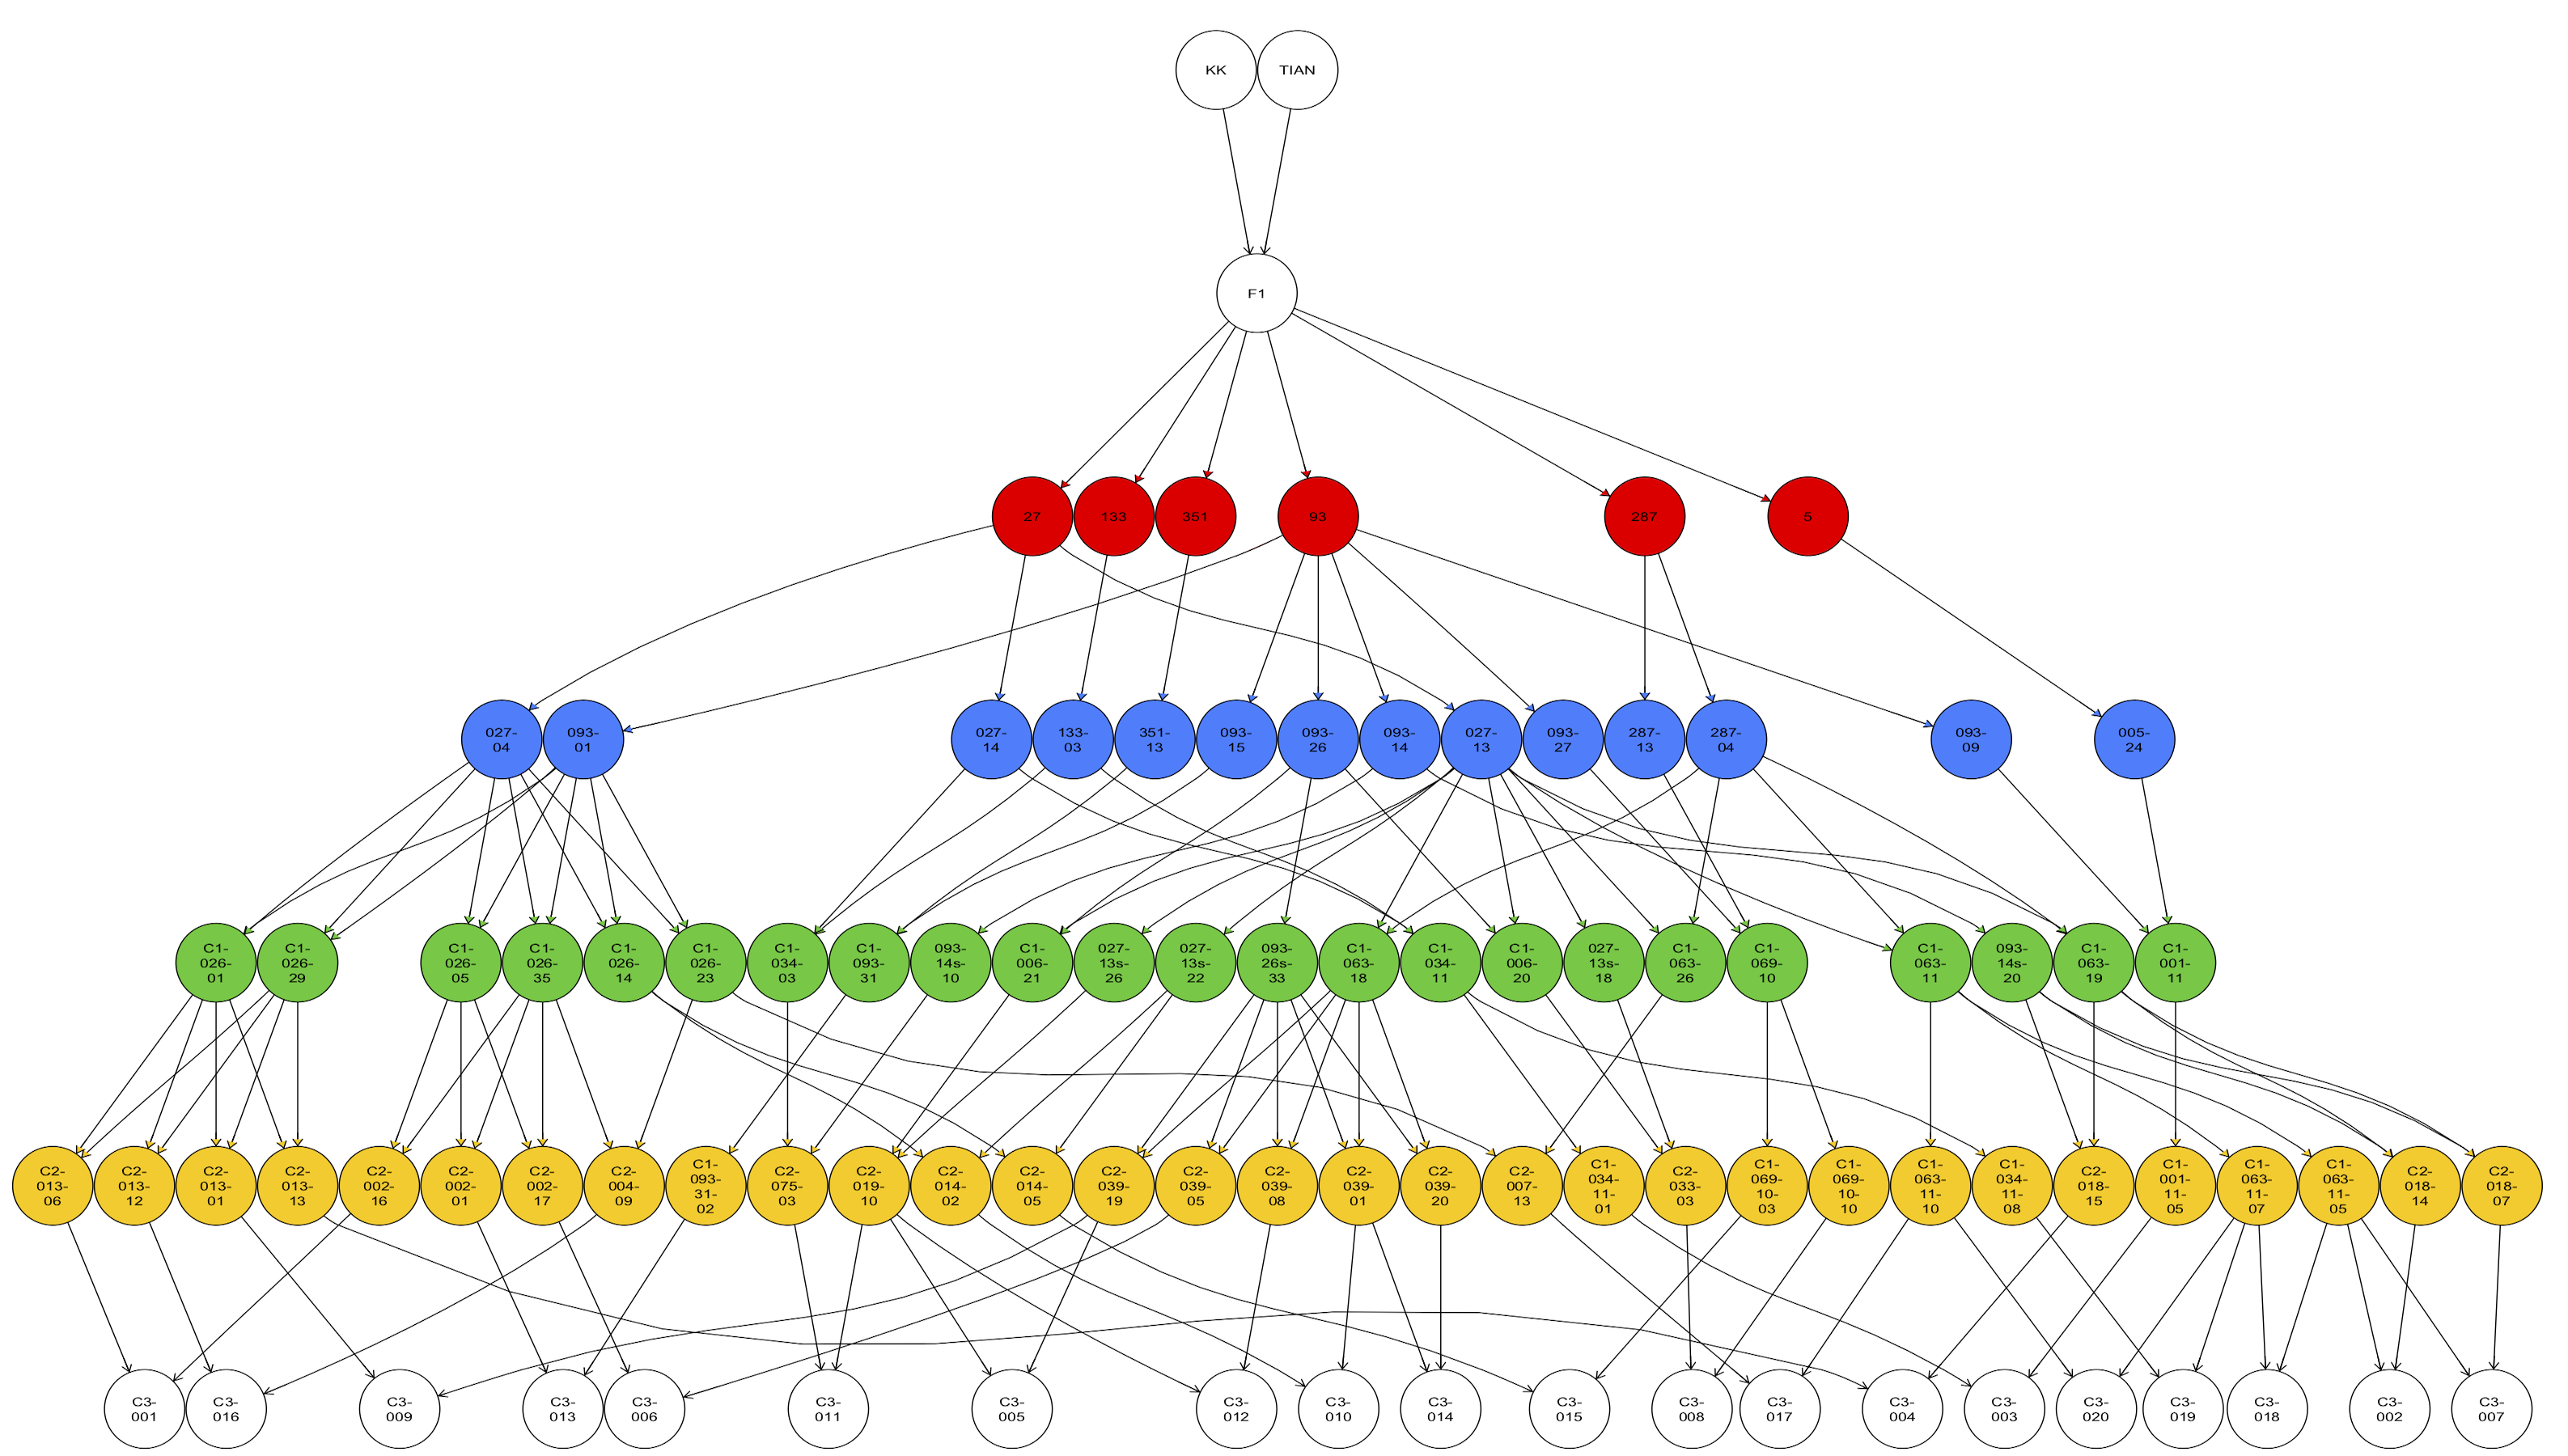
Various numbers of crosses were produced in different selection cycles (See Table 2). Crosses made during the warm off-season (i.e., between March and June) struggled to obtain appropriate flowering time among parents. Globally, about 450 families were produced by MARS for P114, either by crossing or selfing progenies. Figure 6 shows the pedigree of the 20 C3 families produced after 3 cycles, illustrating the level of intercrossing that occurred during the whole process. At each cycle of recurrent selection, many more families were produced, but only those that contributed to the final cycle are represented here.
|
Cycle |
Date |
Nb of plants |
Nb of SNPs |
Nb of Crosses |
Nb of Selfing |
|
C1 |
09/2011 |
724 F4 (20 families) |
140 |
130 |
105 |
|
C2 |
01/2012 |
647 C1 (23 families) |
140 |
125 |
70 |
|
C3 |
03/2013 |
558 C2 + C1 (13 C1 + 19 C2 families) |
150 |
20 |
60 |
Figure 6
The material obtained through MARS was considered as pre-breeding material enriched with favorable QTL. The QTL involved in this process represent genetic factors that were identified and evaluated in experimental conditions, during several years, and in varying locations. The set of QTL involved in the genotypic ideotypes can be considered as a “must-have”. Whereas a significant part of the genetic variation was not explained by the QTL which was still segregating in the populations. For this reason, we developed many different families that accumulated positive alleles at QTL but that were globally very diverse. In addition, early MARS families consisted of non-fixed material (because they resulted from a cross) but needed to be fixed toward pure lines. These families were further field evaluated, and 21 lines that showed good and stable performance were selected.
Variety Registration
1. Agronomic Performances
Procedures for new variety registration in the Economic Community of West African States (ECOWAS), changed in 2009, were followed. The objectives were to guarantee users that every variety is perfectly identifiable and thus distinct, uniform, and stable (DUS) from other registered varieties. This DUS test was conducted in 2017 only at Sotuba. Variety must have a sufficient value for cultivation and use (VCU tests). VCU tests were conducted in Mali in 2016 and 2017, and a multi-location trial network was set up in collaboration with the National Committee for Plant-Based Seeds (CNSOV) at fifteen locations. The experiment included four MARS lines (C0-P114-160A-, C2_075-16, C2_075-15, and C2_007-03) and two registered elite checks (Grinkan and Tiandougou Coura). Sites chosen were between 750–950 mm isohyets in research stations and in farmer or seed companies’ fields. Trials were conducted in randomized, complete block design (RCBD) with four-repetitions. The recommended sorghum population density was used (53,332 plants per hectare), and each plot comprised of 5 rows of 5 meters long, which corresponded to a net plot of 9 m². Chemical fertilizers (73 kg N/ha, 30 kg P/ha) were applied. Analysis of variance (ANOVA) was performed for each environment, and a combined ANOVA was undertaken for all environments. Before pooling trials, Bartlett’s test was used to assess the equality of variance across locations for each variable. Three trials were eliminated because of inequality of variances. Genotype x Environment (GxE) interaction was studied using the Additive Main Effects and Multiplicative Interaction Model (AMMI) (package ‘agricolae’) in the R environment (R_Development_Core_Team, 2008) and by the Finlay-Wilkinson approach (Finlay & Wilkinson, 1963).
The model for the combined analysis across locations was:
Yijk = m + Ei + gj + (gE)ij + bik + eijk
- Yijk is the observation in the ith environment of the jth genotype, in the kth block of the experimental design.
- m is the grand mean
- Ei is the effect of the ith environment
- gj is the effect of the jth genotype
- (gE)ij is the interaction of the jth genotype with the ith environment
- bik is the effect of kth block in ith environment
- eijk is the residual error
The GxE interaction (See Table 3) was not significant for grain yield, which means that despite very large environmental disparities, lines were similar across environments. In a previous study (Sissoko et al., 2018) comparing MARS short varieties with tall landraces, a very strong GxE interaction was detected. In their case, the strong GxE interaction was explained by the very great diversity among tested varieties. In the current variety registration trials, absence of GxE interaction meant that tested varieties were similar in morphology and maturity traits.
|
Source |
Df |
Sum of Squares |
Mean Squares |
F Value |
P Value |
|
Environment (E) |
8 |
117861282 |
14732660 |
16.19 |
0.000 |
|
Block b(E) |
27 |
24575733 |
910212 |
4.54 |
0.000 |
|
Genotype (G) |
5 |
9351668 |
1870334 |
9.33 |
0.000 |
|
Interaction (GxE) |
40 |
8708531 |
217713 |
1.09 |
0.357 |
|
Residuals (e) |
131 |
26273999 |
200565 |
The Finlay-Wilkinson approach is designed to investigate the GxE interaction (See Figure 7). The method consists of fitting for each genotype, a regression of grain yield according to environmental average yield (i.e., the mean response of all varieties in each environment). As the GxE interaction was not significant, the regression lines corresponding to each variety were almost parallel. The regression slope, approximating to 1.0, indicates an average stability, except for C2_007-03 and C2_075-15, which have a significantly lower slope of 0.84.
Figure 7
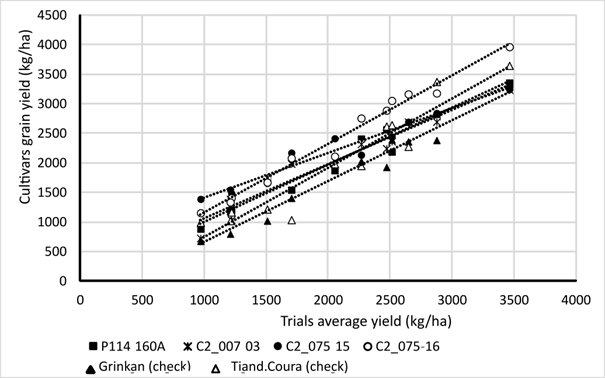
Yields ranged from 1,000 kg/ha to almost 3,500 kg/ha. Table 4 presents the mean grain yield comparison of the six varieties tested. Three homogenous groups were identified. The yield of C2_075-16 was significantly higher than other varieties, including the two checks. The other three MARS varieties have a significantly higher yield than that of the Grinkan check.
| Mean Yield (kg/ha) |
Homogeneous Groups
|
|
| Grinkan (check) | 1809 | c |
| Tiandougou Coura (check) | 2039 | b |
| C2_007-03 | 2150 | b |
| C0_P114-160A- | 2163 | b |
| C2_075-15 | 2247 | b |
| C2_075-16 | 2499 | a |
Note. The means followed by the same letter are not different by Fisher’s least significant difference (LSD) procedure at the 5% threshold.
The technological quality of MARS lines was satisfactory. There were no significant differences among lines and controls in terms of Tô color and texture. The dehulling yield ranged from good (65%) to very good (> 75%). Additionally, MARS lines exhibited significantly lower vitreousness, only C0_P114-160A- showed a vitreousness comparable to checks. The 1,000-kernel weight of the highest-yielding variety (C2_075-16) was significantly less than those of the checks.
2. Climate Adaptation
Methodology for studying adaptation to climate change was presented by Sissoko et al. (2018) and Kouressy et al. (2020) using CERES approach. In this approach, a study of photoperiod sensitivity allowed the calculation of the model’s phenological parameters. Then, the model’s predicted areas where the varieties could be grown at minimal biotic and abiotic risks.
2.1 Phenological Study
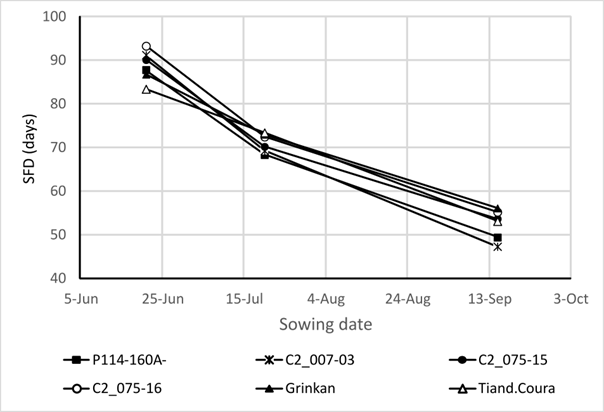
A trial with three sowing dates was used for P114 derived lines/varieties and checks in the phenology study (See Figure 8) under different photoperiod conditions. Phenology was determined by the date of flag-leaf ligulation. In sorghum, this observation is more accurate and repeatable than the scoring of the average flowering date commonly practiced in agronomic experiments (Tarumoto et al., 2003). A split-plot design in two replicates was used. The main factor was the date of planting, and the secondary factor was variety. The sowing dates were June 21, July 20, and September 15. The first two sowing dates were used to determine lines behavior in a farmer’s normal sowing period (i.e., long and intermediate photoperiod), while the third date (i.e., off-season planting) was to study the short photoperiod effect. A drip irrigation system was used to ensure lines development without water deficit.
Figure 8
2.2 CERES Model Coefficient Calculation
Varietal responses to photoperiod were modeled using the sorghum linear CERES model (Alagarswamy & Ritchie, 1991; White et al., 2015). This model was based on a linear adjustment between photoperiod and vegetative phase length (Chantereau et al., 2001; Sanon et al., 2014). After emergence, the shortest thermal time required to reach panicle initiation was known as the Basic Vegetative Phase (BVP). During this phase, floral induction could not occur, no matter the photoperiod conditions. The CERES model considered that below a critical photoperiod (P2O), the vegetative stage duration was constant and equal to the BVP. Above the P2O, the vegetative stage duration increased as a linear function of a photoperiod, whose slope, P2R, defined the photoperiod-sensitivity in degree days per hour of the photoperiod increase (°Cd/h). A modified CERES model version was used (Folliard et al., 2004) whereby photothermal time accumulation was replaced by a critical photoperiod threshold (i.e., varying on plant age) below which sorghum panicle initiation occurred. The three model parameters (P2O, P2R, and BVP) were calculated using a simple method presented by Guitton et al. (2018).
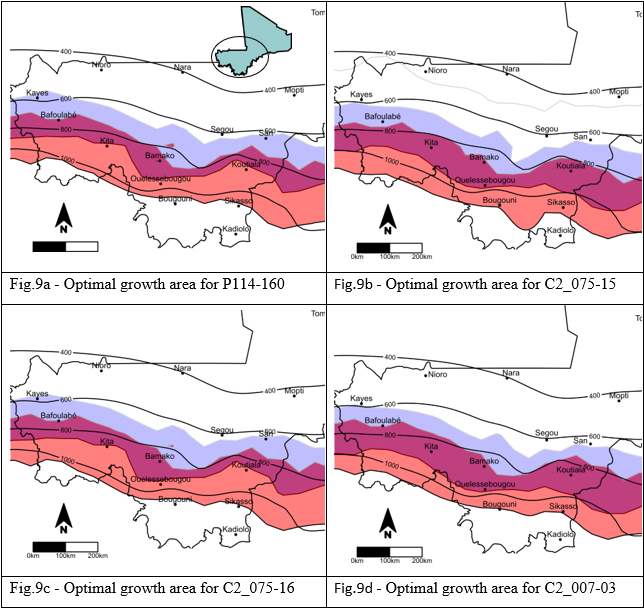
2.3 Delineating Optimal Cultivation Areas
The method used comprised of identifying areas where a variety could be sown during a normal planting period to minimize biotic and abiotic risks. The optimum cultivation area of a variety was determined by combining information on photoperiod sensitivity, climatic variability, and a farmer’s practices (e.g., early and staggering sowing dates; Soumaré, 2004). For each rainfall station in Mali, the onset and end of the rainy season was established using a simplified water balance model (Traoré et al., 2011). The flowering date was predicted using the CERES model. The difference (in days) between the predicted flowering date and the end of the rainy season gave an adaptation index, which was calculated for each variety based on the normal 1981–2010 Malian weather stations’ data. A geographical information system (Surfer® 14, Golden Software, LLC) was used to delineate areas for which the adaptation index was between -20 and 0 because an adapted variety, which flowered in 20 days preceding the end of the rainy season, was considered (Kouressy et al., 2008a).
Spatial distribution of the adaptation index used a model of linear interpolation by kriging. This action was repeated for each variety, considering two sowing dates. A first sowing date was simulated immediately after the rainy season installation and a second sowing date was delayed by one month. This duration, period of sowing, corresponded to the general practice observed in farmers’ fields.
Adaptation zones of the four studied varieties are presented in Figure 9. The delay in sowing caused a shift of the adaptation zone to the south. An overlap of the two zones (in purple), due to photoperiod-sensitivity, corresponded to the optimum growing zone in which variety cultivation is possible within farmers’ sowing periods.
This plant modeling approach revealed merging genetic information, environmental conditions, and sowing practices for predicting crop resilience to climate change scenarios. All optimal growing areas included the Bamako region, for which they were developed. Variety C2_007-03 was slightly more sensitive to photoperiod than the other three varieties. Therefore, its flowering dates were less affected by sowing date and the overlap of the two zones was more important.
Figure 9
Conclusion
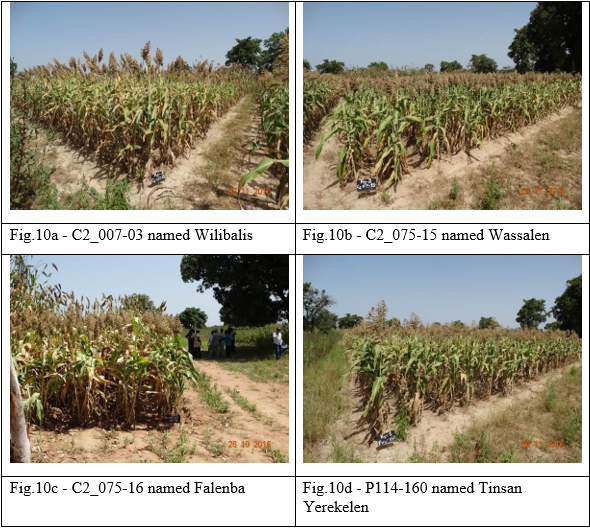
Marker-assisted recurrent selection (MARS) has provided a way to sustainably raise sorghum productivity in future cropping intensification systems. The MARS project is an example of a successful integration of methodology, tools (quality control, genetic analyses, and decision support), services (genotyping), and capacity building into the Malian national sorghum breeding program. The implementation of this approach represented a significant change in conceiving and conducting sorghum breeding, which required qualified support staff and laborers. MARS application improved breeding efficiency because it allowed the rapid and simultaneous accumulation of many traits. Molecular approach alone is not sufficient to produce the end results. Close coordination between field teams and geneticists is necessary. To be successful, the approach must necessarily be trans-disciplinary, including crop physiology and modeling, quantitative genetics, genomic prediction, and breeding. Moreover, after QTL pyramiding, breeding continuation through classical genealogical selection allowed integration of traits not previously considered by genetic analysis. This work is a step towards creating varieties that are resilient to climate change and suitable for sustainable intensification. These two concepts are closely related, as improved climate risk management will provide the foundation for sustainable intensification. The end product of the MARS project was the registration of four elites in national and regional catalogs (Figure 10).
Figure 10
Acknowledgements
This work was made possible thanks to funding from The Generation Challenge Programme (GCP) and from Syngenta Foundation for Sustainable Agriculture (SFSA). The authors would like to thank CIRAD and Syngenta for its technical contributions, the Institut d’Economie Rural (IER) for providing human and research facilities, the NGO CAAD from Koutiala, Camara Seed Compagny, Comptoir 2000sa, Dounka Fa seed company, as well as the producers of Kafara, Ouré (Bougouni), Kolonto, N’Goutjina, and M’pessoba (Koutiala) villages for their participation to the VCU tests and la Direction Nationale de l’Agriculture (DNA) for seed registration.
References
Alagarswamy, G., & Ritchie, J. T. (1991). Phasic development in CERES-sorghum model. In T. Hodges (Ed.), Predicting Crop Phenology (pp. 143–152). CRC Press.
Ayyangar, G. R. (1934). Inheritance of characters in sorghum—the great millet. IV. Brown grains. Indian Journal of Agricultural Sciences, 4, 81–89.
Ayyangar, G. R., Vijiaraghavan, C., Pillai, V., & Ayyar, M. (1933). Inheritance of characters in sorghum–the great millet. II. Purple pigmentation on leaf sheath and glume. Indian Journal of Agricultural Sciences, 3, 589–604.
Basten, C. J., Weir, B. S., & Zeng, Z. B. (2002). QTL Cartographer, Version 1.16. North Carolina State University.
Beyene, Y., Semagn, K., Mugo, S., Prasanna, B. M., Tarekegne, A., Gakunga, J., Sehabiague, P., Meisel, B., Oikeh, S. O., & Olsen, M. (2016). Performance and grain yield stability of maize populations developed using marker-assisted recurrent selection and pedigree selection procedures. Euphytica, 208, 285–297. https://doi.org/10.1007/s10681-015-1590-1
Chantereau, J., Trouche, G., Rami, J. F., Deu, M., Barro, C., & Grivet, L. (2001). RFLP mapping of QTL for photoperiod response in tropical sorghum. Euphytica, 120(2), 183–194. http://doi.org/10.1023/A:1017513608309
Eathington, S. R., Crosbie, T. M., Edwards, M. D., Reiter, R. S., & Bull, J. K. (2007). Molecular markers in a commercial breeding program. Crop Science, 47(S3), 154–163. https://doi.org/10.2135/cropsci2007.04.0015IPBS
Finlay, K., & Wilkinson, G. (1963). The analysis of adaptation in a plant-breeding programme. Australian Journal of Agricultural Research, 14(6), 742–754. https://doi.org/10.1071/AR9630742
Fliedel, G. (1995). Appraisal of sorghum quality for making tô. [Evaluation de la qualité du sorgho pour la fabrication du tô]. [archive]. Agriculture et Développement, 34-42.
Folliard, A., Traore, P. C. S., Vaksmann, M., & Kouressy, M. (2004). Modeling of sorghum response to photoperiod: a threshold-hyperbolic approach. Field Crops Research, 89(1), 59–70. https://doi.org/10.1016/j.fcr.2004.01.006
Guindo, D. (2016). Analyse génétique de la qualité du grain de sorgho pour la fabrication du tô dans le cadre d’un schéma de sélection récurrente assistée par marqueurs. (Doctoral dissertation). Institut National d’Études Supérieures Agronomiques de Montpellier SupAgro (France). No. INESAM 11787356, registered under N°2016/DOC – 31.
Guindo, G., Teme, N., Vaksmann, M., Doumbia, M., Vilmus, I., Guitton, B., Sissoko, A., Mestres, C., Davrieux, F., Fliedel, G., Kouressy, M., Courtois, B., Rami, J.F. (2019). Quantitative trait loci for sorghum grain morphology and quality traits: Toward breeding for a traditional food preparation of West-Africa. Journal of Cereal Science, 85, 256-272.
Guindo, G., Davrieux, F., Teme, N., Vaksmann, M., Doumbia, M., Fliedel, G., Bastianelli, D., Verdeil, J.L., Mestres, C., Kouressy, M., Courtois, B., Rami, J.F. (2016). Pericarp thickness of sorghum whole grain is accurately predicted by NIRS and can affect the prediction of other grain quality parameters. Journal of Cereal Science, 69, 218-227.
Guitton, B., Théra, K., Tékété, M. L., Pot, D., Kouressy, M., Témé, N., Rami, J. F., & Vaksmann, M. (2018). Integrating genetic analysis and crop modeling: A major QTL can finely adjust photoperiod-sensitive sorghum flowering. Field Crops Research, 221, 7–18. https://doi.org/10.1016/j.fcr.2018.02.007
Johnson, R. (2003). Marker-assisted selection. In J. Janick (Ed.), Plant breeding reviews: Part 1: Long-term selection: Maize, volume 24 (pp. 293–310). John Wiley & Sons, Inc.
Karper, R. E. (1932). Grain Sorghum Varieties in Texas. Texas FARMER Collection. https://hdl.handle.net/1969.1/4102
Kouressy, M., Dingkuhn, M., Vaksmann, M., & Heinemann, A. B. (2008b). Adaptation to diverse semi-arid environments of sorghum genotypes having different plant type and sensitivity to photoperiod. Agricultural and Forest Meteorology, 148(3), 357–371. https://doi.org/10.1016/j.agrformet.2007.09.009
Kouressy, M., Sissoko, S., Tékété, M. L., Sanogo, S., Kamissoko, S., Doumbia, M., Sissoko, A., Thera, K., Dingkuhn, M., Koné, A. S., Ouattara, M., Vaksmann, M., & Teme, N. (2020). Sélection du sorgho pour une intensification durable au Mali. Apports de la modélisation. In B. Sultan, A. Y. Bossa, S. Salack, & M. Sanon (Eds.), Risques climatiques et agriculture en Afrique de l’Ouest (pp. 337-352). IRD Éditions.
Kouressy, M., Traoré, S. B., Vaksmann, M., Grum, M., Maikano, I., Soumaré, M., Traoré, P. S., Bazile, D., Dingkuhn, M., & Sidibé, A. (2008a). Adaptation des sorghos du Mali à la variabilité climatique. Cahiers Agricultures, 17(2), 95–100. https://doi.org/10.1684/agr.2008.0189
Peleman, J. D., & van der Voort, J. R. (2003). Breeding by Design. Trends in Plant Science, 8(7), 330ˆ334. https://doi.org/10.1016/S1360-1385(03)00134-1
R_Development_Core_Team. (2008). R: A language and environment for statistical computing. R Foundation for Statistical Computing. Retrieved from http://www.R-project.org” http://www.R-project.org
Rahman, M., Davies, P., Bansal, U., Pasam, R., Hayden, M., & Trethowan, R. (2020). Marker-assisted recurrent selection improves the crown rot resistance of bread wheat. Molecular Breeding, 40(28), 1–14. https://doi.org/10.1007/s11032-020-1105-1
Ribaut, J. M., & Ragot, M. (2007). Marker-assisted selection to improve drought adaptation in maize: the backcross approach, perspectives, limitations, and alternatives. Journal of Experimental Botany, 58(2), 351–360. https://doi.org/10.1093/jxb/erl214
Sako, D. (2013). Genetic analysis for panicle architecture and grain yield in sorghum [Sorghum bicolor (L.) Moench] in Mali. (Doctoral dissertation), University of Ghana. (No. 10293984).
Sanon, M., Hoogenboom, G., Traoré, S. B., Sarr, B., Garcia, A. G. y., Somé, L., & Roncoli, C. (2014). Photoperiod sensitivity of local millet and sorghum varieties in West Africa. NJAS – Wageningen Journal of Life Sciences, 68(0), 29–39. http://doi.org/10.1016/j.njas.2013.11.004
Sissoko, S., Tékété, M. L., Kouressy, M., Thera, K., Dembélé, Y., Doumbia, M., Sissoko, A., Sanogo, S., Diarra, Y., Samake, M., François, R. J., Abdoulaye, G. D., Vaksmann, M., Niangado, O., & Teme, N. (2018). Combined agronomic and climatic approaches for sorghum adaptation in Mali. African Journal of Agricultural Research, 13(35), 1816–1827. https://doi.org/10.5897/AJAR2018.13274
Soumaré, M. (2004). Contribution à la prévision de l’aire de diffusion de variétés de sorgho au Mali. Couplage entre Modèle de Croissance des Cultures et Système d’Information Géographique. (Mémoire de DEA), Institut National Agronomique de Paris-Grignon.
Tarumoto, I., Yanase, M., Iwahara, Y., Kuzumi, Y., Morikawa, T., & Kasuga, S. (2003). Inheritance of a thermo-sensitivity gene controlling flower initiation in sorghum. Breeding Science, 53(4), 353–357.
Traoré, S. B., Alhassane, A., Muller, B., Kouressy, M., Somé, L., Sultan, B., Oettli, P., Siéne Laopé, A. C., Sangaré, S., Vaksmann, M., Diop, M., Dingkhun, M., & Baron, C. (2011). Characterizing and modeling the diversity of cropping situations under climatic constraints in West Africa. Atmospheric Science Letters, 12(1), 89–95. https://doi.org/10.1002/asl.295
Vaksmann, M., Kouressy, M., Chantereau, J., Bazile, D., Sagnard, F., Touré, A., Sanogo, O., Diawara, G., & Danté, A. (2008). Utilisation de la diversité génétique des sorghos locaux du Mali. Cahiers Agricultures, 17(2), 140º145. https://doi.org/10.1684/agr.2008.0190
White, J. W., Alagarswamy, G., Ottman, M. J., Porter, C. H., Singh, U., Hoogenboom, G. (2015). An overview of CERES–sorghum as implemented in the cropping system model version 4.5. Agronomy Journal, 107(6), 1987–2002. https://doi.org/10.2134/agronj15.0102
Witt Hmon, K. P., Shehzad, T., & Okuno, K. (2013). Variation in inflorescence architecture associated with yield components in a sorghum germplasm. Plant Genetic Resources, 11(03), 258–265. https://doi.org/10.1017/S1479262113000154
ENDNOTES
[1] †Died July 07, 2021
