8 Agro-physiological Responses of 10 West Africa Sorghum Varieties to Early Water Deficit Assessed by UAV and Ground Phenotyping
Abstract
Sorghum is a staple food for many in the Sahel. However, it often faces early-stage water deficit resulting in production decrease. Research is focusing on developing early drought tolerant varieties. This study assessed the effects of early drought stress on 10 elite varieties of West African sorghum collection tested over 2 years (2018-2019) in Bambey (Senegal). Water stress was applied by withholding irrigation 25 days after sowing for one month, followed by optimal irrigation until maturity. Soil moisture and agro-physio-morphological traits were monitored. Results showed highly significant effects of early drought stress on sorghum plants growth. The combined analysis of variance revealed highly significant differences (P ≤ 0.01) between varieties in the different environments for most traits studied. Under water deficit, the genotypic adaptation was linked to the capacity of varieties to increase the dead leaves weight and the roots length density and to reduce photosynthesis rate, stomata conductance, and leaf transpiration. The analysis of spectral indices across water treatments revealed significant variation. However, the differential responses between varieties remained the same. Fadda (V1), Nieleni (V2), Soumba (V8) and 621B (V9) showed promising behavior under drought stress and could be suitable for further use in West Africa.
Keywords: early drought tolerance; genetic variability; root adaptation; sorghum
Introduction
Plant adaptation to water deficit is one of the key factors that will determine the severity of climate change on food production, because in the next decade, water availability will be greatly affected by climate change (Molden, 2007). Currently, agriculture uses 75% of the world’s total water consumption and that is likely to increase (Molden, 2007). Food production increases at only 1.2% for the four key global crops—maize, rice, wheat, and soybean—and future demands will cause it to double (Ray et al., 2013). This is also valid for sorghum (Sorghum bicolor (L.) Moench), which is a staple food for millions of people in arid and semiarid tropical regions (Agrama et al., 2003). Its production in Africa has been estimated at 29.83 million tons from 30.54 million hectares of land (FAOSTAT, 2019).
However, the production remains unstable despite cultural practices farmers implemented to adapt and cope with the growing needs and population rise (Chaléard, 2010; Sanchez, 2002). Indeed, the latter has caused strong pressure on the arable land leading to soil depletion.
Actions to promote food security in the Sudano-Sahelian zones include the promotion of local cereal production through the identification of high-performance varieties and the breeding of new varieties. In Senegal, sorghum is one of the most important local cereals grown in the various agro-ecological zones of the country. However, climate change has increased the risk of rainfall shortage during July—the beginning of the growing season (Salack et al., 2012). This could be the cause of the low production (291.171 tons in 2019) (DAPSA, 2019). Early-stage water deficit is experimented with in many research studies by withholding water supply at the beginning of the crop growth cycle, about 3 weeks after germination, for 3 to 4 weeks (Debieu et al., 2018; Qazi et al., 2014; Zegada-Lizarazu & Monti, 2013). This causes a decrease in leaf appearance, transpiration, and photosynthesis through leaf senescence (Craufurd & Peacock, 1993; Dwivedi et al., 2008; Tari et al., 2013). The combined effects of drought and rewatering are still not well-known, especially regarding sorghum. The ability to recover from early water deficit during rewatering can explain in some cases the yield difference between varieties at harvest (Zegada-Lizarazu et al., 2013). The drought recovery index (DRI) represents rewatering-induced recovery of the growth traits related to biomass, height, etc., and would be suitable for investigating drought tolerance. According to Perrier et al., (2017), recovery capacity is an important trait for future phenotyping, genetic and breeding studies while its process and genotypic variability are poorly understood. Late maturity genotypes appeared to be more tolerant to early drought because the stress occurs before the panicle initiation phase, when plants have more ability to recover after rewatering. However, these genotypes no longer suit the farming systems of semiarid regions because of the shortened rainy season. Thus, the solution would be to identify improved short-cycle varieties capable of adapting to early season water stress. This requires a characterization of sorghum behavior under early season water stress and the identification of relevant selection criteria to facilitate the decision on the choice of varieties for cultivation and breeding programs.
Root response is of prime importance to crop productivity under drought stress. This is because the root size, architecture, and distribution determine the ability of plants to access and take up the water for proper physiological functioning of shoots (Henry, 2013; Taiwo et al., 2020). Sorghum’s ability to adapt to water shortage is also due to its root system, which can extend into the deep soil layers. The investigation of this trait through the measurement of root length density (RLD) trait revealed useful (Masi & Maranville, 1998). Researchers have been working to identify specific root traits targeted for plant improvement under drought and limited nutrients conditions (Comas et al., 2013; Girma et al., 2020; Lynch et al., 2014). Recently, greater focus was given to root system architecture, especially the RLD distribution in the soil, which is a key factor for water and nutrient uptake (Chopart et al., 2008; Gregory, 2006). However, field assessment of RLD is not obvious. Among other methods, the trench profile method for mapping root intersection in a soil profile was identified as more efficient and feasible to provide information on roots distribution (Böhm, 1976; Chopart et al., 2008; Tardieu, 1988).
Another method investigated in this study is the use of vegetation indices (VIs) calculated from Unmanned Aerial Vehicle (UAV) multispectral images to phenotype sorghum varieties under drought. Previous findings have promoted VIs related to normalized difference vegetation index (NDVI) as an important multi spectral index to track the agro-physiological dynamics of key traits such as biomass, leaf area index (LAI), yield, etc. (Foster et al., 2017; Magney et al., 2016; Samborski et al., 2015). However, breeders are not aware and have less understanding about the application of the different reflectance bands ratio on monitoring crops development and adaptation. Higher level of NDVI is associated with faster growth rate, higher biomass accumulation during the vegetative stage, and a longer grain filling period by delaying leaf senescence during the ripening phase thereby increasing yield (Babar et al., 2006).
The objectives of this study were to investigate the effects of early water deficit in sorghum to determine the main adaptation mechanisms and simultaneously highlight an interesting method and criteria for the agro-physiological characterization of sorghum in water deficit conditions.
Material and Methods
1. Plant Material
| Variety | Code | Type | Cycle (days) | Height (cm) | Potential yield (t/ha) | Panicle form | Photoperiod-sensitivity | Isohyet (mm) | Origin |
| Fadda | V1 | Guinea (hybrid) | 128 | 200-300 | 4.5 | noncompact | mean | 700-1000 | Mali |
| NIELENI | V2 | Guinea (hybrid) | 115 | 300 | 4 | semicompact | low | 700-800 | Mali |
| IS15401 | V3 | Guinea-Caudatum | 115 | 400-450 | 2 | semicompact | high | 900-1200 | Mali |
| PABLO | V4 | Guinea (hybrid) | 125 | 400 | 4 | noncompact | mean | 700-1000 | Mali |
| CSM63E | V5 | Guinea | 90 | 400 | 2 | noncompact | low | 600-1000 | Mali |
| SK5912 | V6 | Caudatum | 170 | 200 | 2.5-3.5 | semicompact | high | 700-900 | Nigeria |
| GRINKAN | V7 | Caudatum | 90 | 120 | 4 | semicompact | non | 500-800 | Mali |
| SOUMBA | V8 | Caudatum | 115 | 250 | 2.5 | semicompact | low | 600-1000 | Mali |
| 621B | V9 | Caudatum | 105 | 175 | 2.5-3 | semicompact | non | 600-900 | Senegal |
| F2-20 | V10 | Caudatum | 110 | 210 | 3-5.3 | semicompact | low | 600-900 | Senegal |
2. Methods
2.1 Trial Conditions
Trials were conducted at Bambey (14°42’N; 16°28’W) (Senegal) in the Centre National de la Recherche Agronomique (CNRA) on a sandy soil (sand = 94.2%, silt = 3.5%, clay = 2.3%) with a previous cowpea crop. Three trials were carried out between 2018 and 2019 during the dry seasons, which allowed control of the water supply by irrigation. The experimental design is a randomized complete block design, with irrigation as the main factor, and varieties randomized in three replications in each main block. The two water treatments (well-watered [ww] and drought stress [ds]) were placed 10 m apart to avoid involuntary irrigation. A sprinkler method of water supply was provided twice weekly with 25 mm per irrigation (50 mm per week) until physiological maturity. The amount of irrigated water was calculated to cover the weekly average evapotranspiration of sorghum that varied between 25 mm to 37 mm (see Figure 1D). One irrigation was applied before and after sowing to promote good seedling emergence. Fertilizers were applied after sowing and at 21 days after sowing (DAS) as NPK and urea respectively following standard recommendation (i.e., 150 kg ha-1 of NPK [15-15-15] and 100 kg ha-1 of urea). Water stress was applied by withholding irrigation in the drought stress environment for 1 month from the 25th DAS.
2.2 Weather Conditions
Figure 1 shows the climate conditions (vapor pressure deficit [VPD], solar radiation, relative humidity, and temperature) during both experiments. There was a high evaporative demand during these dry seasons as shown by the VPD data that reached 5 KPa during the day. The dry season is characterized by high temperature (above 30°c) and high solar radiation (800 w.m–²) during the day. These climate conditions are representative of the dry season, allowing control over water supply.
Figure 1
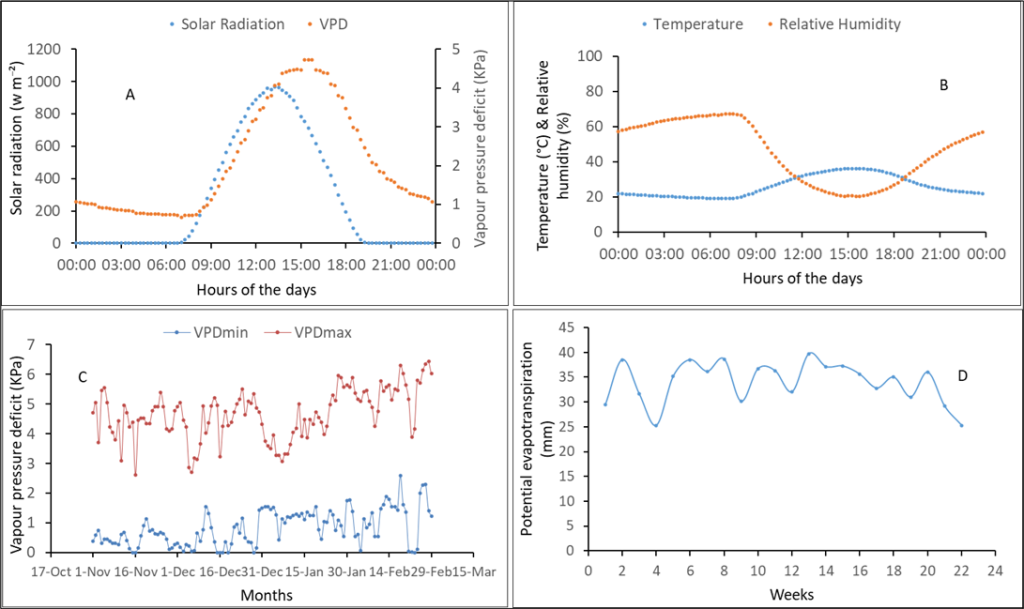
Notes. (A) Daily averages of vapor pressure deficit (VPD) and solar radiation; (B) Temperature and relative humidity; (C) Minimum and maximum VPD; (D) Potential evapotranspiration. Although climate conditions were measured in both years, only representative annual graphics were presented. (A) and (B) were recorded during 2018 experiment and (C) and (D) during the 2019 experiment.
2.3 Monitoring Water Stress
Water stress in the field was monitored by measuring the volumetric soil moisture (Diviner 2000, Sentek Pty Ltd) once a week during the irrigated period and twice a week during the stress period to assess the fraction of transpirable soil water (FTSW) (Debieu et al., 2018; Sinclair & Ludlow, 1986). Diviner probe tubes of 1.6 m length were used to record water stock at every 10 cm of depth. In this work, a total of 1.6 m depth water stock was considered to assess the FTSW as this depth represents the sorghum’s root activity zone. Soil moisture measurements allowed us to follow the level of stress down to FTSW = 0.3 at the end of the stress period. The average of the three most contrasted varieties was used to evaluate the general trend. We also monitored the predawn leaf water potential once a week using the pressure chamber (PMS Instrument Co., Corvallis, Oregon, USA) according to the protocol of Peyrano et al. (1997). The plant’s water potential was measured before sunrise, when there is a balance between plant and soil for water potential.
2.4 Assessment of Agro-physiological Traits
Plants’ agro-physiological traits—such as number of leaves appeared (NLA) and plant height after stress (PHS)—were measured on three tagged plants per plot. The photosynthesis rate (Pn), leaf temperature (Tleaf), transpiration (Tr), and stomata conductance (C) were measured on the last ligulate leaf using the CI340 handheld photosynthesis system (CID Bio-science, USA). Biomass production was evaluated by estimating plant dry weight (DWP) and dead leaves weight (DLW) using six plants per plot at seven different dates (before the stress, at the end of the stress, and after recovery [2 weeks after rewatering]). At physiological maturity, grain yield, plant height (PHT) and straw dry biomass (SDW) were measured. The specific leaf area (SLA) was calculated as the ratio between plant leaf area and biomass.
Moreover, other morphological traits were measured weekly during drone flights on three randomly tagged plants per plot, from crop emergence (25 DAS) to flowering-maturity stage (89 DAS). Seven sampling weeks’ data were used for LAI and biomass. LAI was measured using the SunScan septometer (Delta-T Devices, Cambridge, England). Nondestructive measurements (LAI) were performed just before UAV flights. Plants were sampled, dried outdoors for 2 weeks, and oven-dried for 3 days before biomass measurements were taken using ad-venturer pro precision balance (OHAUS Corporation, Pine Brook, New Jersey, NJ, USA).
To better study the recovery performance and classify varieties, we introduce a new parameter that we have named the DRI. The DRI represents the relative recovery of the growth traits (NLA, PHS, DWP, Pn) after a freely defined time of drought stress followed by rewatering. This approach was inspired by the drought factor index (DFI) used by Strauss et al. (2006) for the detection of dark chilling tolerance in soybean genotypes and by Oukarroum et al., (2007) for probing the response of barley cultivars under drought stress conditions. DRI was calculated by applying the formula:
DRI= log A + 2 log B (1)
in which A is the relative trait measured at the end of the drought period and B is the relative trait measured 2 weeks after rewatering. The relative trait is calculated as trait drought over trait control. The principle of the DRI is that recovery efficiencies should play an important role on the production capacity of some genotypes. Varieties with DRI near to zero have good recovery and varieties with DRI around -1 have bad recovery index (Oukarroum et al., 2007).
2.5 Roots Phenotyping
Root measurements were done on two tagged plants per plot. We used the described methods, to count the number of adventitious roots and estimate RLD from intersections between the roots and the face of a soil trench profile (Chopart et al., 2008; Dusserre et al., 2009; Faye et al., 2019). The trench profiles were dug perpendicular to the rows of seedlings and at two distances (20 cm then 10 cm) from the plant stem. Iron grids of 60 cm length by 30 cm width, in relation to the spacing between rows and between plants, were used to count root impacts. Square meshes of 10 cm side length were made inside the grids to facilitate the measurement of the number of impacts. At the end of the stress period, the plants were dug up for additional measurements on the tilling tray, such as the number of adventitious roots.
2.6 UAV Data Capture and Image Analyses
Time series flights were done at the altitude of 25 m and a constant speed of 2.2 m.s-1 with the hexacopter drone (FeHexaCopterV2, MikroKopter Company, Moormerland, Germany). Seven UAV weekly flight data, from emergence to maturity, were recorded. Nine grey colored ground control points (GCPs) were uniformly distributed over the entire field area with fixed position for all the flights throughout the experiment. These were surveyed using Precis BX305 Real Time Kinematics (RTK) GNSS unit (Tersus GNSS Inc., Shanghai, China). The GCPs were made of painted PVC disks of 60 cm diameter where the central disk of 40 cm diameter was 20% gray level and the outer disk 60% gray level color. These gray levels were selected to avoid saturation and allow automatic target detection on the images. The UAV system, equipped with six motors, can perform user-defined waypoint flights with a differential global navigation satellite system (GNSS) receiver. The UAV support software (Mikrokopter tools, Mikrokopter Company, Moormerland, Germany) that implements the flight plan also monitors the flight and records information such as drone position. The flight was performed with an RGB ILCE-6000 digital camera (Sony Corporation, New York, NY, USA) with a 6000×4000-pixel sensor equipped with a lens of 60 mm focal length. To minimize the blurring effect and noise in the images, the camera was set on speed priority (1/1250 sec) and auto ISO mode. Another flight was performed with an Airphen multispectral camera (hi-phen, Avignon, France, https://www.hiphen-plant.com/) equipped with a lens of 8 mm focal length and acquiring 1280×960-pixel images. The Airphen consists of six individual cameras equipped with filters centered on 450 nm, 530 nm, 560 nm, 675 nm, 730 nm, and 850 nm, with a spectral resolution of 10 nm. For each camera (RGB and MS), the flight lasted about 15 minutes with a break of approximately 10 minutes in between to prepare the second flight. The cameras captured images at 1-second intervals and recorded them in JPG and Tiff format on the SD memory card. The drone did round trips spaced by 4 m that allowed a side and forward overlapping fraction of 0.75. To reduce the effects of ambient light conditions, such as plant shadow that can greatly affect spectral measures especially between rows at maturity stages, the flights were limited to clear and cloudless days between 10:00 a.m. and 12:00 a.m. UTC.
An automatic image-processing pipeline was designed to generate radiometrically calibrated and geometrically corrected multiband orthoimages using Agisoft PhotoScan digital photogrametric software version 1.4.0 (Agisoft LLC, St. Petersburg, Russia, https://www.agisoft.com/downloads/installer) (see Part 2 Chapter 1, Mbaye et al. in this book). Radiometric calibration included automatic correction of vignetting effects (Iqbal et al., 2018). Real reflectances were computed using a reference target positioned to the ground during UAV flights. This target was previously spectrally characterized in controlled conditions. Geometric correction involved firstly, multiband coregistration to modify and adjust the images’ coordinate system to decrease geometric distortions and make pixels in different pictures coincide with the corresponding map-grid points. The coregistration process was based upon the internal GNSS from raw image metadata. Orthorectification was then performed using GCPs to increase the accuracy of the generated orthoimage. As Agisoft Photoscan manages multilayer images, we used the 450 nm band for tie point searching. For a better plots segmentation, we uploaded the RGB orthoimage in QGIS (Geographical Information SYSTEMS, version 3.10.0, QGIS Development Team, open source 2019, https://www.qgis.org/fr/site/forusers/download.html) and designed the plots boundaries. The created shapefile with the GNSS coordinates of each plot was exported as spatial vector data. The extraction of the average values of the varieties’ vegetation index in each plot was performed according to the GNSS coordinates of plots, extracted on QGIS and MS orthoimage. The computation was performed using R software (version 3.6.0) libraries (sf, raster, rgdal, RSToolbox and uavRst) (R Core Team, 2020). Four vegetation indices (NDVI, CTVI, MSAVI2 and SR) were used to estimate LAI and biomass during the dry seasons of 2018 and 2019. These vegetation indices are single values computed by grid calculation.
They are invariant to the difference in illumination conditions, slope, seasons, etc. They represent a quick way to distinguish green leaves from other objects and to estimate the relative biomass present on the image, therefore, distinguishing stressed vegetation from nonstressed (Li et al., 2018; Shi et al., 2016; Steven et al., 2015; Zhang et al., 2017).
2.7 Statistical Analyses
The raw data were analyzed using R software version 3.6.0 (www.r-project.org). An analysis of variance was performed for each environment (ww and ds) to verify statistical differences between varieties. Subsequently, a combined analysis of variance was performed to test the effects of water stress and years on varieties. The homogeneity between residual variances was tested using Bartlett’s test (Bartlett, 1937). RLD was modeled on the basis of measurements of root intersections density (RID) on a vertical perpendicular plane within a sorghum row because this method is most commonly used for studying roots in a soil profile. Relationships between RLD and RID were evaluated taking the slope, the standard error of the slope (SE), the intercept, and the regression (r²) into account. Ordinary least squares linear regression models were applied. Regression models were developed to predict LAI and biomass using vegetation indices. The performance of regression models in estimating LAI and biomass were evaluated by calculating the root mean squared error (RMSE), the coefficient of determination (r2) and p-values at the probability level of 0.05.
Results
1. Water Stress
During the irrigation period, FTSW and predawn leaf water potential showed a very low variation and revolved around 0.7 and -1.5 bars, respectively (see Figure 2). However, when the plots in the ds treatment were let to dry down, FTSW and predawn leaf water potential decreased progressively and reached 0.3 and -5 bars respectively, showing an effective drought stress experience that occurred between 35 DAS and 55 DAS. Thereafter, after resuming irrigation, these parameters increased again and stabilized around the initial values with a slight drop (0.6 and -2 bars for FTSW and predawn leaf water potential, respectively).
Figure 2
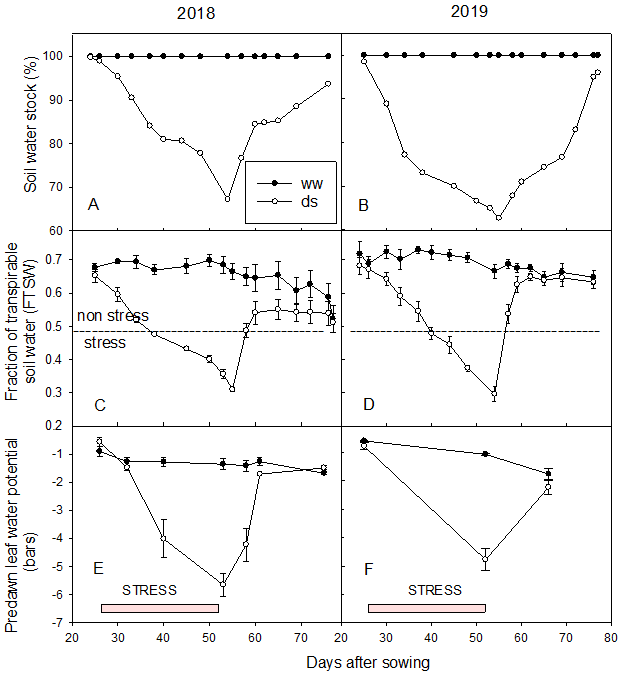
Notes. (A) Evolution of soil moisture stock (%) in 2018 and (B) in 2019; (C) Fraction of transpirable soil water in 2018 and (D) in 2019; (E) Predawn leaf water potential (bar) in 2018 and (F) in 2019.
2. Effects of Early Water Deficit on Growth, Recovery, and Yield
Table 2 presents the effects of water deficit on agro-physiological traits assessed in the experiments. The results showed highly significant differences (P ≤ 0.01) between the different environments for all the characters under study. The early water deficit led to a reduction of leaf appearance (NLA) (-9.18% in 2018 and -6.75% in 2019); PHS (-16.37% and -48.99%); Pn (-12.45% and -27.75%); C (-18.37% and -35.32%); and Tr (-26.37% and -25.92%). After maturity and harvest, we observed a decrease in yield (-22.78% and – 28.15%), SDW (-18.25% and -27.79%) and PHT (-15.01% and -23.23%). However, we noticed an increase in the DLW (+43.29% and +15.10%) and Tleaf (+1.29% and +7.64%).
| Year 2018 | Year 2019 | |||||||
| Traits | Mean ww | Mean ds | ΔWS | Signif. | Mean ww | Mean ds | ΔWS | Signif. |
| NLA | 15.33a | 13.92b | -9.18 | *** | 15.30a | 14.26b | -6.75 | *** |
| PHS | 143.89a | 120.33b | -16.4 | *** | 130.55a | 66.59b | -49 | *** |
| DLW | 13.65b | 19.56a | 43.29 | *** | 14.22b | 16.37a | 15.1 | *** |
| PHT | 174.83a | 148.58b | -15 | *** | 165.75a | 127.24b | -23.2 | *** |
| SDW | 453.38a | 370.61b | -18.3 | *** | 427.35a | 308.60b | -27.8 | *** |
| Yield | 3271.85a | 2526.21b | -22.8 | *** | 2419.84a | 1738.64b | -28.2 | *** |
| Pn | 39.32a | 34.43b | -12.5 | *** | 41.38a | 29.90b | -27.8 | *** |
| C | 184.94a | 150.97b | -18.4 | *** | 179.14a | 115.88b | -35.3 | *** |
| Tr | 7.43a | 5.47b | -26.4 | *** | 7.04a | 5.22b | -25.9 | *** |
| Tleaf | 39.02b | 39.53a | 1.29 | ** | 39.16b | 42.15a | 7.64 | *** |
NLA: number of leaves appeared; PHS: plant height after stress (cm); DLW: dead leaves weight (g); PHT: plant height (cm); SDW: Straw dry weight (g); Yield: grain yield (kg/ha); Pn: photosynthesis rate; C: stomata conductance; Tr: leaf transpiration; Tleaf: leaf temperature; Signif: significance at p:s 0.001 (***) and p:s 0.01 (**); ΔWS: delta water stress (%). For a given trait, numbers followed by the same letters are not significantly different between water treatments.
Figure 3 represents the monitoring of C, SLA per plant, plant height, NLA on the main stem. DWP, and Pn of varieties under both conditions (ww and ds). The results showed that the number of leaves on the main stem, plant height, and dry weight per plant gradually increased in a similar way between varieties, but the advent of water stress induced a drop. These results indicated that water stress causes significant reduction in biomass production and shoots growth in sorghum. The SLA of the plant, which reflects the thickness of the leaves, the C, and the (Pn) initially increased to reach their maximum at the 30th DAS, before gradually decreasing until maturity. In the water-stressed environment, the drop in SLA, C, and Pn was greater than in the nonstressed conditions. After the end of the stress period, these traits rebounded but without recovering to the SLA, C, and Pn values of the nonstressed environment. In terms of height and biomass, the varieties have all lost pace despite the high plasticity found in sorghum.
Figure 3
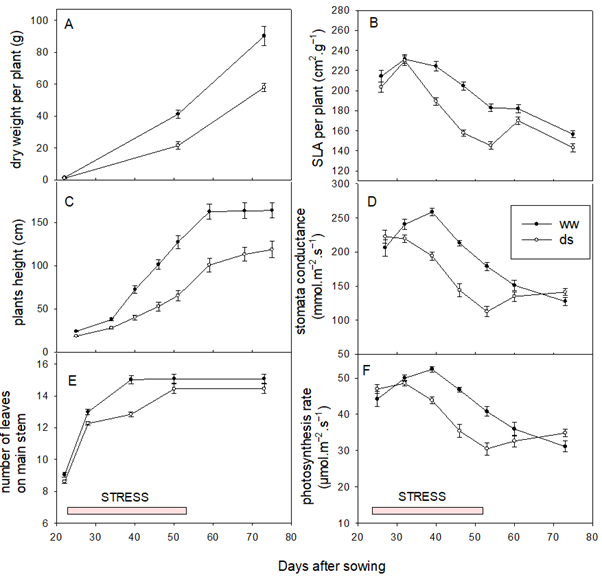
Note. (A) Dry weight per plant, (B) Specific leaf area (SLA) per plant, (C) Plant height, (D) Stomata conductance, (E) Number of leaves, (F) Photosynthesis rate
Sorghum varieties that exhibited the smallest values of DRI had more problems recovering. We noted that varieties had good recovery in the NLA and Pn with a DRI of -0.11 and -0.04 respectively. However, varieties’ recovery on PHS and the DWP was more difficult with a DRI of -0.62 and -0.65 respectively (see Table 3). The results indicated a best recovery on plant height and dry weight for the variety V3 and V1 respectively; varieties V4, V5, and V6 revealed the worst recovery on the same traits.
|
Drought Recovery Index (DRI)
|
||||
| Varieties | NLA | PHS | DWP | Pn |
| V1 | -0.04 | -0.54 | -0.32 | -0.22 |
| V2 | -0.1 | -0.43 | -0.6 | -0.24 |
| V3 | -0.12 | -0.33 | -0.75 | -0.08 |
| V4 | -0.13 | -0.81 | -0.98 | 0.07 |
| V5 | -0.1 | -0.68 | -0.64 | 0.35 |
| V6 | -0.09 | -0.8 | -0.97 | -0.16 |
| V7 | -0.13 | -0.55 | -0.93 | -0.05 |
| V8 | -0.11 | -0.77 | -0.57 | 0.12 |
| V9 | -0.12 | -0.62 | -0.44 | -0.18 |
| V10 | -0.12 | -0.69 | -0.32 | 0 |
| MEAN | -0.11 | -0.62 | -0.65 | -0.04 |
NLA: number of leaves appeared; PHS: plant height after stress; DWP: dry weight per plant; Pn: photosynthesis rate
3. Adaptation Responses to Early Water Deficit
The combined analysis of variance revealed highly significant differences (P ≤ 0.05) between varieties; environment; and the interactions between variety (V), environment (E), and year (Y), (V*E, V*Y, E*Y and V*E*Y) (see Table 4). Variety V7 showed the smallest number of leaves and PHS; V6 and V3 recorded respectively the highest values for these traits. Varieties V8 and V4 had the highest DLW in both years; V1, V6, and V9 recorded the smallest values. At harvest, variety V5 exhibited the highest plant height and SDW but the lowest grain yield. V7 and V9 exhibited the lowest plant height and SDW respectively. V1 and V10 recorded the highest grain yield under ww conditions in 2019 and 2018 respectively; V1 and V9 recorded the highest one under ds conditions in 2019 and 2018 respectively.
| NLA | PHS | DLW | |||||
| V | ww | ds | ww | ds | ww | ds | |
| Year 2018 | V1 | 14.6cd | 13.5bc | 133.7bc | 111.7bcd | 5.7e | 13.9cd |
| V2 | 15.3bc | 13.6bc | 125.7bc | 101.6bcd | 16.8ab | 28.7a | |
| V3 | 15.5abc | 13.2bc | 204.3a | 179.3a | 12.6bcd | 25.8a | |
| V4 | 15.5abc | 13.8bc | 200.6a | 137.5b | 10.7cde | 17.3bc | |
| V5 | 15.0bc | 13.5bc | 186.3a | 193.5a | 6.0e | 16.6bc | |
| V6 | 16.6a | 15.9a | 108.5cd | 91.2cd | 7.8de | 9.9de | |
| V7 | 13.5d | 12.4c | 92.5d | 86.2cd | 14.2bc | 19.2b | |
| V8 | 16.0ab | 14.4ab | 147.5b | 111.8bcd | 22.4a | 26.9a | |
| V9 | 15.7abc | 14.9ab | 98.4d | 74.0d | 18.3ab | 8.6e | |
| V10 | 15.1bc | 13.8bc | 141.0b | 116.1bc | 21.4a | 28.3a | |
| Grand mean | 15.3a | 13.9b | 143.8a | 120.3b | 13.6b | 19.5a | |
| ANOVA | |||||||
| V | *** | *** | *** | *** | *** | *** | |
| E | *** | *** | *** | ||||
| V×E | ns | ** | *** | ||||
| Year 2019 | V1 | 15.7ab | 13.7a | 120.4a | 77.5a | 13.7d | 15.1e |
| V2 | 16.5a | 14.2a | 140.6a | 83.5a | 14.9ab | 16abcd | |
| V3 | 15.0ab | 13.8a | 163.1a | 103.1a | 11.9f | 15.7de | |
| V4 | 15.2ab | 14.3a | 107.3a | 38.3a | 15.3a | 16.1cd | |
| V5 | 15.5ab | 14.3a | 154.6a | 68.5a | 14.8ab | 16.3bcd | |
| V6 | 16.0a | 15.3a | 107.1a | 60.8a | 12.6e | 16.1cd | |
| V7 | 13.5b | 14.1a | 106.5a | 55.3a | 14.5bc | 16abcd | |
| V8 | 15.8ab | 14.4a | 124.5a | 49.0a | 15.1ab | 17.2a | |
| V9 | 15.1ab | 14.4a | 99.4a | 53.5a | 15.0ab | 17.1ab | |
| V10 | 14.3ab | 13.7a | 149.4a | 66.3a | 14.0cd | 16.7abc | |
| Grand mean | 15.3a | 14.2b | 130.5a | 66.5b | 14.2b | 16.3a | |
| ANOVA | |||||||
| V | * | ns | ns | ns | *** | *** | |
| E | *** | *** | *** | ||||
| V×E | ns | ns | *** | ||||
| Both years |
Y | ns | *** | *** | |||
| V×Y | * | *** | *** | ||||
| E×Y | ns | *** | *** | ||||
| V×E×Y | ns | ** | * |
| PHT | SDW | YIELD | |||||
| V | ww | ds | ww | ds | ww | ds | |
| Year 2018 | V1 | 172.5cd | 148.9cd | 427.6bc | 358.7abc | 4183.4abc | 3182.3b |
| V2 | 162.8d | 140.4cde | 470.2abc | 349.3abc | 3715.9d | 3359.3b | |
| V3 | 191.2bc | 193.6ab | 498.7ab | 409.0abc | 2001.5e | 1817.6de | |
| V4 | 205.6b | 161.3bc | 530.0ab | 449.8ab | 1606.4ef | 1540.3e | |
| V5 | 235.3a | 215.6a | 603.2a | 461.4a | 1473.1f | 1168f | |
| V6 | 159.8d | 133.6cde | 408.0bc | 424.4ab | 3926abcd | 2598.3c | |
| V7 | 127.2e | 108.9e | 315.0c | 294.5bc | 3812.1cd | 2006.9d | |
| V8 | 168.1d | 126.0de | 496.8ab | 339.9abc | 3922bcd | 3132.8b | |
| V9 | 152.2d | 117.1de | 321.5c | 259.3c | 4246.0ab | 3851.7a | |
| V10 | 169.3cd | 140.0cde | 451.0abc | 359.3abc | 4349.3a | 2643.02c | |
| Grand mean | 174.8a | 148.5b | 453.3a | 370.6b | 3271.85a | 2526.21b | |
| ANOVA | |||||||
| V | *** | *** | *** | ** | *** | *** | |
| E | *** | *** | *** | ||||
| V×E | * | Ns | *** | ||||
| Year 2019 | V1 | 173.2cd | 127abcd | 494.2bc | 377.3abc | 3876.8a | 2424a |
| V2 | 149.4de | 120.1bcd | 404.5bcd | 259.0bc | 2127.7cd | 2070.3abc | |
| V3 | 216.7ab | 170.4abc | 329.6cd | 323.0abc | 1886.4d | 1752.5bc | |
| V4 | 204.6bc | 183.2ab | 791.2a | 399.4ab | 1233.9e | 1124.5de | |
| V5 | 250.8a | 198.2a | 564.5b | 428.4a | 771.2f | 817.4e | |
| V6 | 137.9ef | 88.4d | 413.2bcd | 274.0abc | 3429.2ab | 1582bcd | |
| V7 | 109.2f | 93.4d | 380.8bcd | 246.5c | 3166.7b | 2027.6abc | |
| V8 | 143def | 106.1cd | 330.4cd | 267.8abc | 2514.8c | 2087.6ab | |
| V9 | 131.4ef | 101.8cd | 303.7d | 272.0abc | 2105.5cd | 2037abc | |
| V10 | 140def | 102.6cd | 382.6bcd | 278.3abc | 3085.8b | 1462.9cd | |
| Grand mean | 165.7a | 127.2b | 427.3a | 308.6b | 2419.84a | 1738.64b | |
| ANOVA | |||||||
| V | *** | *** | *** | ** | *** | *** | |
| E | *** | *** | *** | ||||
| V×E | * | ** | *** | ||||
| Both years |
Y | *** | *** | *** | |||
| V×Y | *** | ** | *** | ||||
| E×Y | ns | ** | * | ||||
| V×E×Y | ns | ns | *** |
ww: well-watered; ds: drought stress; NLA: number of leaves appeared; PHS: plant height after stress; DLW: dead leaves weight; PHT: plant height at harvest; SDW: Straw dry weight; Yield: grain yield; V: variety; E: environment; Y: year; *** significant at p = 0.001; ** significant at p = 0.01; * significant at p = 0.05; ns: not significant. The means with the same letters are not significantly different. The bold values indicate the highest and lowest value measured.
Physiological traits like photosynthesis rate, stomata conductance, leaf transpiration, and leaf temperature revealed a wide range of genetic variability among the varieties under both ww and ds conditions (see Table 5). The effects of variety, environment, and their interaction (V× E) were highly significant in both years. Under ww conditions, variety V1 recorded the highest photosynthesis rate, stomata conductance, and leaf transpiration; V5, V9, and V2 recorded respectively the lowest values for the same traits in 2018. However, the occurrence of drought stress induced various responses in these varieties. Variety V10 recorded the lowest photosynthesis rate in 2018 but the highest rate in 2019, showing variation in the behavior of this variety from year to year. Overall, a decrease of photosynthesis rate, stomata conductance, and leaf transpiration—and an increase of leaf temperature—were the physiological responses of the studied varieties to early water deficit (see Table 5).
| Pn | C | Tr | Tleaf | ||||||
| V | ww | ds | ww | ds | ww | ds | ww | ds | |
| Year 2018 | V1 | 43.14a | 31.92abc | 213.06a | 119.35cd | 9.34a | 5.06ab | 36.34cd | 40.70ab |
| V2 | 41.57ab | 33.29abc | 189.14ab | 101.85d | 7.00b | 4.00b | 34.80d | 39.12abc | |
| V3 | 39.88ab | 39.66a | 179.04ab | 169.84ab | 7.12b | 6.42a | 40.30ab | 39.83abc | |
| V4 | 38.99ab | 38.61a | 169.08b | 140.07abcd | 7.38b | 5.58ab | 40.77a | 39.77abc | |
| V5 | 35.64b | 26.05bc | 169.11b | 128.31bcd | 7.13b | 4.45ab | 39.87ab | 39.08bc | |
| V6 | 42.17ab | 39.83a | 202.09ab | 181.85a | 7.56ab | 6.16a | 39.32ab | 40.94a | |
| V7 | 40.69ab | 37.81a | 194.62ab | 181.45a | 6.39b | 5.89a | 40.40ab | 39.54abc | |
| V8 | 38.16ab | 38.02a | 182.93ab | 183.21a | 7.68ab | 6.36a | 40.83a | 38.51c | |
| V9 | 36.05ab | 35.74ab | 166.88b | 166.72ab | 7.50ab | 6.53a | 39.34ab | 39.02bc | |
| V10 | 37.70ab | 22.96c | 186.72ab | 147.17abc | 7.22b | 4.61ab | 37.83bc | 38.75c | |
| Grand mean | 39.32a | 34.43b | 184.94a | 150.97b | 7.43a | 5.47b | 39.02b | 39.53a | |
| ANOVA | |||||||||
| V | * | *** | ** | *** | ** | *** | *** | ** | |
| E | *** | *** | *** | ** | |||||
| V×E | *** | *** | *** | *** | |||||
| Year 2019 | V1 | 47.03a | 22.66c | 193.03a | 78.41c | 7.28ab | 4.00b | 38.75b | 42.86ab |
| V2 | 42.37abc | 29.28abc | 189.03a | 108.90bc | 7.25ab | 5.17ab | 39.98a | 42.72ab | |
| V3 | 41.56abc | 35.05ab | 191.45a | 140.03ab | 6.70abc | 5.73ab | 40.44a | 41.68bc | |
| V4 | 37.76bc | 34.51ab | 137.08b | 135.79ab | 6.12c | 5.40ab | 38.30bc | 43.11a | |
| V5 | 41.08abc | 27.06abc | 167.77ab | 96.88bc | 7.24ab | 4.96ab | 39.94a | 40.73c | |
| V6 | 38.79abc | 26.58abc | 165.52ab | 94.97bc | 6.89abc | 5.23ab | 40.50a | 42.12ab | |
| V7 | 43.72ab | 35.59ab | 194.77a | 177.36a | 7.65a | 6.18a | 37.36c | 42.34ab | |
| V8 | 34.15c | 27.81abc | 164.44ab | 98.39bc | 6.56bc | 4.78ab | 40.00a | 40.62c | |
| V9 | 43.24ab | 25.57bc | 190.44a | 93.53bc | 7.14abc | 4.64ab | 37.63bc | 43.27a | |
| V10 | 44.10ab | 36.41a | 197.92a | 134.17ab | 7.61a | 6.11a | 38.67b | 42.06ab | |
| Grand mean | 41.38a | 29.90b | 179.14a | 115.88b | 7.04a | 5.22b | 39.16b | 42.15a | |
| ANOVA | |||||||||
| V | ** | *** | *** | *** | *** | * | *** | *** | |
| E | *** | *** | *** | *** | |||||
| V×E | *** | *** | ** | *** | |||||
| Both years | Y | ns | *** | ** | *** | ||||
| V×Y | *** | *** | *** | * | |||||
| E×Y | *** | *** | ns | *** | |||||
| V×E×Y | *** | *** | ** | ** | |||||
ww: well-watered; ds: drought stress; Pn: photosynthesis rate; C: stomata conductance; Tr: leaf transpiration; Tleaf: leaf temperature; SDW: Straw dry weight; V: variety; E: environment; Y: year; *** significant at p = 0.001; ** significant at p = 0.01; * significant at p = 0.05; ns: not significant. The means with the same letters are not significantly different. The bold values indicate the highest and lowest value measured.
The RLD was estimated by RID along the soil profiles using the geometrical model for both ww and ds treatments at the end of the stress. Our results showed a strong and significant effect of water deficit on the number of total roots (NTR) and RLD profiles (see Table 6).
Varieties V1 and V8 exhibited the highest NTR in ww and ds conditions respectively, while V2 and V10 exhibited the lowest in ww and ds conditions respectively. Among varieties, V4 exhibited the lowest RLD (0 cm – 120 cm) in both the ww and ds environment. Under drought stress, V1 and V8 recorded the strongest RLD in the shallow horizon (0 cm – 50 cm) and deep horizon (60 cm – 120 cm) respectively (see Table 6). From the data presented in Table 6, the global trend of the varieties’ root system’s responses to early drought stress is highlighted on Figure 4. Drought stress induced significant reduction of RLD in the 0 cm – 50 cm soil horizon; it increased in the 60 cm –120 cm deep soil layers.
| NTR | RLD [0-120cm] | RLD [0-50cm] | RLD [60-120cm] | |||||
| V | ww | ds | ww | ds | ww | ds | ww | ds |
| V1 | 63.00a | 28.66ab | 1922.80a | 1687.83g | 3457.35c | 2764.00a | 800.02c | 1578.33c |
| V2 | 32.00f | 22.33cd | 1760.68bc | 2041.48c | 3286.61e | 2698.90b | 654.07f | 1571.89c |
| V3 | 40.33c | 26.00bc | 1751.29bc | 1769.92f | 3358.45d | 2435.41f | 648.08f | 1294.57e |
| V4 | 50.33b | 31.66a | 1467.24e | 1574.29h | 2519.95h | 2236.74g | 715.29e | 1090.53f |
| V5 | 62.66a | 28.66ab | 1781.89bc | 1945.37e | 3245.57e | 2641.44c | 719.73e | 1448.18d |
| V6 | 40.00cd | 28.66ab | 1739.46bc | 1993.00d | 3564.50b | 2520.00e | 873.33a | 1421.00d |
| V7 | 36.00e | 25.33bc | 1827.72b | 2190.90b | 3311.3de | 2598.55d | 772.75cd | 1807.34b |
| V8 | 42.00c | 30.66a | 1991.88a | 2453.95a | 3659.27a | 2704.23b | 800.89c | 2266.67a |
| V9 | 37.00de | 25.00bcd | 1625.93d | 1687.83g | 2738.30g | 2271.24g | 831.38b | 1271.11e |
| V10 | 37.00de | 21.33d | 1696.45cd | 1757.95f | 3121.66f | 2428.02f | 763.37d | 1279.32e |
| Grand mean | 44.03a | 26.83b | 1758.61b | 1897.27a | 3214.64a | 2522.88b | 757.89b | 1502.8a |
| ANOVA | ||||||||
| V | *** | *** | *** | *** | *** | *** | *** | *** |
| E | *** | *** | *** | *** | ||||
| V×E | *** | *** | *** | *** |
ww: well-watered; ds: drought stress; NTR: number of total roots; RLD: root length density (m m−2); [0–120 cm], [0–50 cm] and [60–120 cm] represent the depth considered; V: variety; E: environment; *** significant at p = 0.001. Means with the same letters are not significantly different. The bold values indicate the highest and lowest value measured.
Figure 4
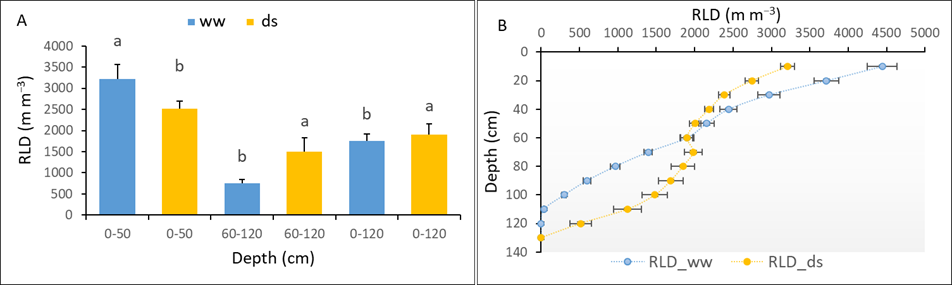
Notes. (A) RLD distribution at [0-50], [60-120] and [0-120] depth horizons (B) Impact of water deficit on RLD profile. Data are means +/- standard error. Significant differences are indicated by different letters.
4. Relationship Between Vegetation Indices and Sorghum’s Growth Traits
Results presented in Table 7 show the relationship between LAI, biomass, and vegetation indices. Nonlinear and linear regression models were fitted using the 2018 field data set (n = 390, calibration data). Regression analysis revealed a good relationship between LAI or biomass with NDVI, CTVI, GNDVI, MSAVI2, and SR. To assess the performance of vegetation indices to estimate LAI, we compared the coefficients of determination (r2) of the relationships between NDVI, CTVI, MSAVI2, SR, and LAI that were respectively of 0.83, 0.82, 0.76 and 0.77 with highly significant p values. However, the r2 for biomass estimation using the same indices were comparatively lower than those for LAI (0.6, 0.6, 0.57, and 0.47).
| Vegetation indices | Regression models | r | r² | P-value |
| NDVI | LAI=0.3732*e2.9648*NDVI | 0.91 | 0.83 | <0.001 |
| CTVI | LAI=0.0069*e5.5322*CTVI | 0.9 | 0.82 | <0.001 |
| MSAVI2 | LAI=0.3392*e2.7498*MSAVI2 | 0.9 | 0.82 | <0.001 |
| SR | LAI=0.4438*SR+0.0126 | 0.87 | 0.77 | <0.001 |
| NDVI | Biomass = 3.1153*e3.7021*NDVI | 0.77 | 0.6 | <0.001 |
| CTVI | Biomass = 0.0206*e6.9446*CTVI | 0.77 | 0.6 | <0.001 |
| MSAVI2 | Biomass = 2.7357*e3.4587*GNDVI | 0.77 | 0.6 | <0.001 |
| SR | Biomass = 6.0128*SR + 0.8947 | 0.68 | 0.47 | <0.001 |
NDVI, CTVI, MSAVI2 and SR: vegetation indices; r: coefficient of correlation; r²: coefficient determination; LAI: leaf area index.
Figure 5 shows the NDVI plots with the corresponding LAI. The LAI values varied from 0.3 m2 m−2 to 5.7 m2 m−2 per plant across varieties, treatments, and developmental stages during the calibration trial in 2018. A saturation of the different vegetation indices was observed above LAI values higher than 4 m2 m−2 per plant. To test the variance of calibration models, an ordinary least squares linear regression between calculated and measured LAI was done, and it revealed an r2 value of 0.8 for LAI (see Figure 5). The ANOVA revealed highly significant effect of varieties, environment, and the interaction (V*E) (p<0.05) on both calculated and measured LAI and biomass with almost the same values (see Tables 8 and 9).
Figure 5
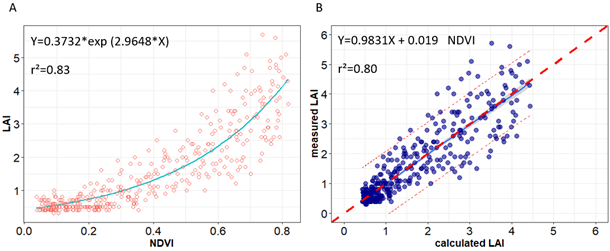
Notes. (A) Relationship between normalized difference vegetation index (NDVI) and leaf area index (LAI); (B) Measured LAI vs. corresponding LAI values predicted using empirical equation in Figure 5A. The dashed red line in the graph is the 1:1 line.
| LAIc_NDVI | LAIc_CTVI | LAIm | ||||
| V | ww | ds | ww | ds | ww | ds |
| V1 | 1.5 | 0.62 | 1.53 | 0.62 | 1.9 | 0.6 |
| V2 | 1.56 | 0.61 | 1.59 | 0.61 | 1.9 | 0.8 |
| V3 | 2.09 | 0.7 | 2.12 | 0.72 | 1.57 | 0.9 |
| V4 | 1.6 | 0.58 | 1.63 | 0.57 | 1.4 | 0.45 |
| V5 | 1.95 | 0.56 | 1.97 | 0.56 | 2.23 | 0.6 |
| V6 | 1.39 | 0.7 | 1.43 | 0.7 | 1.63 | 0.57 |
| V7 | 2.01 | 0.53 | 2.03 | 0.52 | 1.9 | 0.47 |
| V8 | 1.93 | 0.68 | 1.96 | 0.69 | 2.63 | 0.8 |
| V9 | 1.78 | 0.64 | 1.81 | 0.65 | 1.53 | 0.67 |
| V10 | 1.74 | 0.48 | 1.77 | 0.47 | 1.57 | 0.53 |
| Mean | 1.75 | 0.61 | 1.78 | 0.61 | 1.83 | 0.64 |
| V | * | * | ** | |||
| E | *** | *** | *** | |||
| V*E | * | * | * |
V: varieties; E: environment; ww: well-watered; ds: drought stress; CTVI and NDVI: vegetation indices; Significance codes: ‘***’ 0.001 ‘**’ 0.01 ‘*’ 0.05
| BPPc_MSAVI2 | BPPc_SR | BPPm | ||||
| V | ww | ds | ww | ds | ww | ds |
| V1 | 17.62 | 5.53 | 21.12 | 9.69 | 18.3 | 15.7 |
| V2 | 18.27 | 5.38 | 22.08 | 9.54 | 22.55 | 10.79 |
| V3 | 25.85 | 6.65 | 27.56 | 10.5 | 19.11 | 12.36 |
| V4 | 18.73 | 4.96 | 22.38 | 9.01 | 17.38 | 7.9 |
| V5 | 23.94 | 4.73 | 26.1 | 8.93 | 29.82 | 11.84 |
| V6 | 15.77 | 6.62 | 20.49 | 10.49 | 23.87 | 11.39 |
| V7 | 24.47 | 4.35 | 28.25 | 8.57 | 35.72 | 8 |
| V8 | 23.59 | 6.32 | 26.84 | 10.36 | 27.32 | 9.21 |
| V9 | 21.52 | 5.76 | 24.51 | 9.87 | 22.49 | 18.88 |
| V10 | 21 | 3.75 | 24.55 | 7.91 | 18.28 | 5.86 |
| Mean | 21.08 | 5.42 | 24.39 | 9.5 | 23.48 | 11.31 |
| V | * | * | *** | |||
| E | *** | *** | *** | |||
| V*E | * | ** | *** |
V: varieties; E: environment; ww: well-watered; ds: drought stress; MSAVI2 and SR: vegetation indices; Significance codes: ‘***’ 0.001 ‘**’ 0.01 ‘*’ 0.05
5. Assessment of the Impact of Water Treatment on UAV Derived Traits
The combined analysis of variance revealed highly significant effect (P ≤ 0.05) of the environment (E), variety (V), and their interaction (V*E) on all the vegetation indices under study (see Table 10). In ww conditions, the varieties recorded on average 0.6, 1.08, 0.76, 7.37 for NDVI, CTVI, MSAVI2, and SR respectively; the stressed plants showed lower values (i.e., 0.37, 0.90, 0.44, and 3.01). In ds conditions, the variety V3 exhibited the highest indices (0.59, 0.94, 0.66 and 4.02 for NDVI, CTVI, MSAVI2, and SR); V10 had the lowest (0.20, 0.83, 0.25, and 1.74).
| NDVI | CTVI | MSAVI2 | SR | |||||
| V | ww | ds | ww | ds | ww | ds | ww | ds |
| V1 | 0.63 | 0.38 | 1.06 | 0.92 | 0.71 | 0.46 | 6.83 | 3 |
| V2 | 0.68 | 0.37 | 1.08 | 0.91 | 0.76 | 0.44 | 6.77 | 3 |
| V3 | 0.73 | 0.59 | 1.11 | 0.94 | 0.81 | 0.66 | 7.97 | 4.02 |
| V4 | 0.7 | 0.33 | 1.09 | 0.89 | 0.77 | 0.4 | 7.53 | 2.71 |
| V5 | 0.71 | 0.39 | 1.1 | 0.94 | 0.79 | 0.47 | 7.91 | 2.85 |
| V6 | 0.62 | 0.36 | 1.05 | 0.89 | 0.7 | 0.42 | 5.69 | 3.24 |
| V7 | 0.74 | 0.28 | 1.11 | 0.88 | 0.81 | 0.35 | 8.59 | 2.2 |
| V8 | 0.74 | 0.45 | 1.11 | 0.94 | 0.81 | 0.53 | 8.17 | 4.46 |
| V9 | 0.7 | 0.4 | 1.09 | 0.94 | 0.78 | 0.49 | 6.99 | 2.92 |
| V10 | 0.67 | 0.2 | 1.08 | 0.83 | 0.75 | 0.25 | 7.33 | 1.74 |
| Mean | 0.69 | 0.37 | 1.08 | 0.9 | 0.76 | 0.44 | 7.37 | 3.01 |
| V | ** | ** | *** | * | ||||
| E | *** | *** | *** | *** | ||||
| V*E | * | * | * | * |
V: varieties; E: environment; NDVI, CTVI, MSAVI2 and SR: vegetation indices (VIs); ww: well-watered; ds: drought stress; Significant codes: ‘***’ 0.001 ‘**’ 0.01 ‘*’ 0.05
Results presented in Figure 6 showed the general trend of the evolution of VIs during plants growth in both ww and ds conditions. The vegetation indices of nonstressed plants gradually increased to reach their maximum at the 60th DAS (flowering time) before dropping slightly. In the stressed plots, the vegetation indices initially recorded a slight increase but then water deficit induced a reduction that was followed by a progressive increase after rewatering.
However, the VIs values of stressed plants did not recover values of the nonstressed plants. The results highlighted in this study testify the relevance of VIs to capture the differences induced by drought and that occurred from the 30th DAS to the 55th DAS. The post flowering decrease of the VIs observed in the ww treatment was due to the saturation of the VIs as plants have grown up enough in this environment.
Figure 6
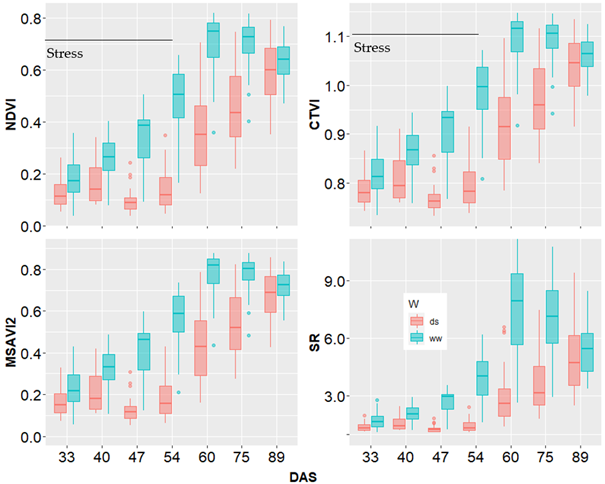
Note. Box plots represent the estimations for all the 10 sorghum varieties at a given stage. NDVI, CTVI, MSAVI2 and SR: vegetation indices; DAS: days after sowing; ds: drought stress; ww: well-watered.
Discussion
1. The Adaptive Behavior of the Sorghum Varieties Studied
The stress characterization revealed very negative values of water potential (WP = -5 bars) at the end of the stress period. This can be explained by the intensity of the stress experienced by the plants (FTSW = 0.3). To counteract the water deficit that occurs in their tissues, plants implement water retention mechanisms with very high energy. Consequently, it is necessary to provide equivalent energy to extract this water from the tissues (Brou et al., 2007). The behavior of the sorghum varieties, which consists in maintaining a high level of hydration despite the stress pressure, reflects a dehydration tolerance mechanism, with a low water potential of the tissues (Levitt, 1985). This limits cell growth because of loss of turgidity.
Water-limiting conditions lead to altered cell elongation, mainly due to low water flow from the xylem to neighboring cells (Fahad et al., 2017; Nonami, 1998). The number of leaves and the size of each leaf were reduced in drought conditions because their expansion depends on the turgor pressure and the amount of water assimilated. This induced a decrease in plant biomass accompanied by a reduction in leaf appearance and plant growth. Regarding physiological traits, drought stress causes a decrease in the transpiration rate, photosynthetic activity, and stomata conductance (Dwivedi et al., 2008; Fracasso et al., 2016). This adaptation mechanism also was revealed in pearl millet (Kholova et al., 2009, 2010) and cowpea (Belko et al., 2012). Under water deficit, the diffusion of CO2 to the carboxylation sites is limited because of stomata closure and increased mesophyll resistance. This inhibits the transport of electrons, leading to an imbalance between the electron transport rate and
CO2 fixation rate (Verma et al., 2018). The photosynthetic performance is one of the parameters providing useful and quantitative information on plants condition and vitality (Banks, 2018; Oukarroum et al., 2007; Zegada-Lizarazu & Monti, 2013). Tingting et al. (2010) showed that the process of photosynthesis is sensitive to changing environmental conditions, and the way in which plants adapt to their environment is propitious to photosynthesis. The recovery of photosynthesis upon rewatering indicates that the PSII systems had recovered their ability to deal with the absorbed light and the accumulated energy. Hence, oxidative permanent damage may not have occurred at the early growth stages, or as suggested by Oukarroum et al. (2007), the maximum quantum yield of photochemistry was not affected by the drought. The drop of plant growth rate caused by the lack of water during a given period often leads to difficulties in covering the normal development in terms of height or biomass (Hud et al., 2016). This behavior is not always a disastrous consequence. It could be a means of adaptation that allows the plant to maintain its development but at a slower pace. This was the case of the variety V6, for instance, which produced well despite a low DRI in height and biomass. These are part of physiological functioning that confer drought tolerance to sorghum (Hadebe et al., 2017; Harris et al., 2007; Kapanigowda et al., 2013). The agro-physiological behavior of a plant depends on the genotype, the severity of the drought, and the time of occurrence (Chaves et al., 2002; Jaleel et al., 2008). Early water stress acts differently on sorghum varieties depending on the variety’s stage of development. It is well-known that when drought occurs at the vegetative stage before panicle exertion, plants recover better. This may explain why the agronomic performances of some long-duration varieties of the guinea and bicolor breed (V1, V4) were weakly affected by early cycle drought. Long-duration varieties were able to catch up and stabilize production despite a lack of water at the early stage. According to Araus et al. (1989), this phenomenon is due to stomata control, which is more effective in the young growth stages. This could have been the case of variety V1, which responded to water deficit by closing its stomata, thus allowing it to limit exchanges with the environment until water conditions become favorable and the growth could resume and compensate for the losses due to drought. Contrariwise, V4 showed the lowest DRI and a slight variation of stomata conductance and yield under drought stress. A hypothesis is that this variety recovered well after the 2 weeks allowed for recovery measurement. However, the drought adaptation conferred by the long cycle is not sufficient to consider such varieties appropriate for the future. Previous studies have shown that the duration of drought episodes at the beginning of the season is likely to increase with the worsening of global climate change impacts (Blanc, 2012; Vadez et al., 2012), therefore even long-duration varieties may be affected by early drought stress if the duration is long.
Roots play an important role as a support, but also provide the plant with the water and mineral elements it needs. Thus, their study represents a very effective means of characterizing drought adaptation. Some authors showed that the spatial distribution of root length density determines water and nutrient uptake (Intergovernmental Panel on Climate Change, 2014). In the present study, the varieties V1 and V8 turned out to be very interesting. They yielded well under drought, and their adaptations were mainly based on a high RLD (60 cm – 120 cm) (V8) and the increase of dead leaves (V8 and V1) contrarily to V4, which had the lowest RLD (60 cm – 120 cm) and a low grain yield. Additionally, some varieties have densified their root system to be able to exploit a larger surface area of soil and to increase the absorption of water and mineral nutrients (Comas et al., 2013). The high root density at depth allows them to reach moisture in the deeper soil layers and compensate for the lack of water supply.
Although the varieties V3, V4, and V5 were less productive, they could be of high interest for height or fodder breeding programs. Varieties V1, V2, V8, and V9 could be devoted for grain yield breeding. Phenotypic evaluation of germplasm can be useful for characterization, conservation, and maintenance of genetic resources (Naoura et al., 2019). This study revealed a large agro-morphological diversity of quantitative traits. Overall, the results showed that plant response to early drought was genotype dependent (Sinclair et al., 2018) and some varieties expressed a strong ability to reduce water loss by decreasing leaf transpiration rate through stomata closure and increasing the number of dead leaves. These were among the adaptation strategies used by the studied varieties to tolerate drought stress conditions in both seasons.
2. Monitoring Plant Growth by UAV Based Phenotyping
Recent advances in high throughput field phenotyping have boosted the power of physiological breeding (Araus & Cairns, 2014; Fahlgren et al., 2015; Hu et al., 2018; Reynolds & Langridge, 2016). Currently, UAV technology is an alternative to the manual collection of crop data, offering information on traits and factors affecting crop development and productivity with relatively shorter time and lower cost (Du & Noguchi, 2017; Yu et al., 2016). The moderate to strong relationships (see Table 7) found between the UAV-derived plant spectral traits and the leaf area index and the biomass indicate that UAVs could be useful for phenotyping West Africa sorghum genotypes (Gano et al., 2021). The NDVI is an indicator of the combined effects of chlorophyll concentration, canopy leaf area, and yield (Erdle et al., 2011). The estimation of the NDVI can be used as a reference index for the dynamic monitoring of the biomass changes during the growth season of sorghum. NDVI estimates are influenced by many factors, such as measurement time, sensors, and environmental conditions (Crusiol et al., 2017), and there is no one absolutely accurate measurement method for NDVI estimation. Improved precision would also contribute to further applications for field management (Foster et al., 2017). Results presented herein demonstrate the importance of using NDVI related vegetation index as indirect selection criteria by reporting genetic variation for VIs among varieties, the effect of water treatment on VIs and their interaction with varieties, and the relationships between VIs and LAI and biomass of sorghum. This attests the ability of VIs in estimating growth rate, biomass accumulation during the vegetative stage and yield set up (Babar et al., 2006).
3. Key Traits Involved in Drought Tolerance for Breeding
As a major challenge for agricultural production, drought tolerance is a prime target for molecular approaches to crop improvement. To obtain significant results, these approaches must be based on phenotyping protocols that are appropriate at all stages of plant development (Salekdeh et al., 2009). Because drought adaptation traits are complex and polygenic, the understanding of their physiological and genetic basis is still incomplete. This challenge comes at a time when plant biologists are witnessing an explosion in the availability of new high-throughput technologies and genomic information. However, the identification of preferred selection criteria remains unclear and still makes phenotyping laborious. According to Passioura (1977), the conceptual framework for drought phenotyping is based on the equation expressing the product yield of WU (quantity of water used), WUE (conversion of WU into dry biomass), and HI (the fraction of dry matter converted into grain). Therefore, it is important to design experiments to test these factors by distinguishing the impact of WU and WUE on production. In other words, when looking at productivity, it is important to identify the effects of growth stress that may affect assimilations transport. By considering these components of performance individually, it is possible to target traits more effectively in relation to environmental constraints. In the case of early-cycle water stress, there are several key phenotypic traits highlighted (see Table 11) to help target phenotyping. In addition, it would be useful to select high yielding genotypes that are stable across environmental conditions and years. To do so, it would be interesting to follow growth-related traits such as plant height and NLA, DWP, Tr and Pn because these traits are susceptible to environmental changes.
| Traits | Stage | Phenotyping technique |
Interest for breeding
|
| Root Length Density (RLD) | Growth | Count | Yield |
| Number of adventitious roots | Growth | Count | Yield |
| Soil water stock | Growth | Metric | Yield |
| Biomass rate | Growth | Metric | Biomass |
| Plant height rate | Growth | Metric | Biomass |
| Dead leaves weight | Growth | Metric | Yield |
| Photosynthesis rate | Growth | Metric | Yield |
| Transpiration rate | Growth | Metric | Yield |
| NDVI | Growth | Metric | Biomass |
| Grain weight | Harvest | Metric | Yield |
| Number of grains | Harvest | Count | Yield |
| Stem dry weight | Harvest | Metric | Biomass |
Moreover, this study demonstrated successful and rapid assessment of NDVI related VIs (CTVI, MSAVI2 and SR) using a UAV platform that showed high accuracy in assessing variation in plant development. The accuracy of the UAV platform was validated by ground truth data, and it proved a significant advantage of UAV over the handheld data acquisition platform from the stem elongation stage to late grain filling stage, especially under water- limited conditions.
Drought-prone environments are diverse and the biotic and abiotic stresses that affect yield during drought periods are numerous (Richards et al., 2002). Therefore, our objective is not to propose unique criteria for drought stress phenotyping. Rather, we suggest that each experiment be conducted with a specific, realistic goal and with WUE and yield set up as reference traits (Venuprasad et al., 2007). Such reference traits will ensure the relevance of field results that are assessed and deposited in public databases for a standardized recording and reporting of drought-related phenotypic data.
Conclusion
This study is justified by the challenge that researchers have set to improve adaptation to early drought stress in cereals, particularly sorghum. We have shown the impact of water deficit on sorghum growth and development. The early stress is a major factor in the evolution of biomass, height, and leaf development. Even though it occurred early, its impact leads to yield instability. This study also highlighted plant adaptation mechanisms under early water deficit based on growth; photosynthesis and transpiration reduction; senescence increase; stomata closure; and roots length density increase. We also highlighted the ability of UAV platform to phenotype drought stress in West Africa sorghum varieties. Finally, we proposed key phenotyping traits that involve the different factors that govern production for a more efficient characterization of drought adaptation. Future areas of study could include phenotyping entire sorghum collections in different growing conditions during the year to better fix the adaptation mechanisms. Based on the predictions of precariousness linked to climate change, it would be more than necessary to select varieties that are able to adapt and stabilize performance independently of the season and year.
References
Agrama, H. A., & Tuinstra, M. R. (2003). Phylogenetic diversity and relationships among sorghum accessions using SSRs and RAPDs. African Journal of Biotechnology, 2(10), 334–340. https://doi.org/10.5897/ajb2003.000-1069
Araus, J. L., & Cairns, J. E. (2014). Field high-throughput phenotyping: the new crop breeding frontier. Trends in Plant Science, 19(1), 52–61. https://doi.org/10.1016/j.tplants.2013.09.008
Araus, J. L., Tapia, L., & Alegre, L. (1989). The effect of changing sowing date on leaf structure and gas exchange characteristics of wheat flag leaves grown under Mediterranean climate conditions. Journal of Experimental Botany, 40(6), 639–646. https://doi.org/10.1093/jxb/40.6.639
Babar, M. A., Reynolds, M. P., van Ginkel, M., Klatt, A. R., Raun, W. R., & Stone, M. L. (2006). Spectral reflectance indices as a potential indirect selection criteria for wheat yield under irrigation. Crop Science, 46(2), 578–588. https://doi.org/10.2135/cropsci2005.0059
Banks, J. M. (2018). Chlorophyll fluorescence as a tool to identify drought stress in Acer genotypes. Environmental and Experimental Botany, 155, 118–127. https://doi.org/10.1016/j.envexpbot.2018.06.022
Bartlett, M. S. (1937). Properties of sufficiency and statistical tests. Proceedings of the Royal Society of London. Series A, 160(901), 268–282. https://doi.org/10.1098/rspa.1937.0109
Belko, N., Zaman-Allah, M., Cisse, N., Diop, N. N., Zombre, G., Ehlers, J. D., & Vadez, V. (2012). Lower soil moisture threshold for transpiration decline under water deficit correlates with lower canopy conductance and higher transpiration efficiency in drought- tolerant cowpea. Functional Plant Biology, 39(4), 306–322. https://doi.org/10.1071/FP11282
Blanc, E. (2012). The impact of climate change on crop yields in Sub-Saharan Africa.
American Journal of Climate Change, 1(1), 1–13. https://doi.org/10.4236/ajcc.2012.11001
Böhm, W. (1976). In situ estimation of root length at natural soil profiles. The Journal of Agricultural Science, 87(2), 365–368. https://doi.org/10.1017/S0021859600027660
Brou, Y. C., Diouf, O., Zeze, A., & Eyletters, M. (2007). Statut hydrique et capacités photosynthétiques de deux variétes de niébé (Vigna unguiculata (L.) Walpers) soumises au stress hydrique. Agronomie Africaine, 19(1), 29–40.
Chaléard, J.-L. (2010). Les réponses de l’agriculture aux défis démo-économiques (The responses of agriculture to demo-economic challenges). Bulletin de l’Association de Géographes Français, 87(1), 40–55. https://doi.org/10.3406/bagf.2010.8180
Chaves, M. M., Pereira, J. S., Maroco, J., Rodrigues, M. L., Ricardo, C. P. P., Osório, M. L., Carvalho, I., Faria, T., & Pinheiro, C. (2002). How plants cope with water stress in the field? Photosynthesis and growth. Annals of Botany, 89(7), 907–916. https://doi.org/10.1093/aob/mcf105
Chopart, J.-L., Sine, B., Dao, A., & Muller, B. (2008). Root orientation of four sorghum cultivars: application to estimate root length density from root counts in soil profiles. Plant Root, 2(Böhm 1976), 67–75. https://doi.org/10.3117/plantroot.2.67
Comas, L. H., Becker, S. R., Cruz, V. M. V., Byrne, P. F., & Dierig, D. A. (2013). Root traits contributing to plant productivity under drought. Frontiers in Plant Science, 4, 1–16. https://doi.org/10.3389/fpls.2013.00442
Craufurd, P. Q., & Peacock, J. M. (1993). Effect of heat and drought stress on sorghum (sorghum bicolor). II. Grain yield. Experimental Agriculture, 29(1), 77–86. https://doi.org/10.1017/S0014479700020421
Crusiol, L. G. T., Carvalho, J. de F. C., Sibaldelli, R. N. R., Neiverth, W., do Rio, A., Ferreira, L. C., Procópio, S. de O., Mertz-Henning, L. M., Nepomuceno, A. L., Neumaier, N., & Farias, J. R. B. (2017). NDVI variation according to the time of measurement, sampling size, positioning of sensor and water regime in different soybean cultivars. Precision Agriculture, 18(4), 470–490. https://doi.org/10.1007/s11119-016-9465-6
DAPSA, Direction de l’Analyse, de la Prévision et des Statistiques Agricoles (2019). Rapport d’évaluation préliminaire des récoltes de la campagne 2018/2019 et de la sécurité alimentaire et de la nutrition. Senegal. https://www.dapsa.gouv.sn/
Debieu, M., Sine, B., Passot, S., Grondin, A., Akata, E., Gangashetty, P., Vadez, V., Gantet, P., Foncéka D., Cournac, L., Hash, C. T., & Kane, N. A. (2018). Response to early drought stress and identification of QTLs controlling biomass production under drought in pearl millet. PLOS ONE, 13. https://doi.org/10.1371/journal.pone.0201635
Dembele, J. S. B., Gano, B., Kouressy, M., Dembele, L. L., Doumbia, M., Ganyo, K. K., Sanogo, S., Togola, A., Traore, K., Vaksman, M., Teme, N., Diouf, D. & Audebert, A. (2021). Plant density and nitrogen fertilization optimization on sorghum grain yield in Mali. Agronomy Journal, 113(6), 1–16. https://doi.org/10.1002/agj2.20850.
Dembele, J. S. B., Gano, B., Vaksmann, M., Kouressy, M., Dembele, L. L., Doumbia, M., Teme, N.; Diouf, D., & Audebert, A. (2020). Response of eight sorghum varieties to plant density and nitrogen fertilization in the Sudano-Sahelian zone in Mali. African Journal of Agricultural Research, 16(10), 1401–1410. https://doi.org/10.5897/AJAR2020.15025
Du, M., & Noguchi, N. (2017). Monitoring of wheat growth status and mapping of wheat yield’s within-field spatial variations using color images acquired from UAV-camera System. Remote Sensing, 9(3). https://doi.org/10.3390/rs9030289
Dusserre, J., Audebert, A., Radanielson, A., & Chopart, J.-L. (2009). Towards a simple generic model for upland rice root length density estimation from root intersections on soil profile. Plant and Soil, 325(1), 277–288. https://doi.org/10.1007/s11104-009-9978-0
Dwivedi, S., Perotti, E., & Ortiz, R. (2008). Towards molecular breeding of reproductive traits in cereal crops. Plant Biotechnology Journal, 6(6), 529–559. https://doi.org/10.1111/j.1467-7652.2008.00343.x
Erdle, K., Mistele, B., & Schmidhalter, U. (2011). Comparison of active and passive spectral sensors in discriminating biomass parameters and nitrogen status in wheat cultivars.
Field Crops Research, 124(1), 74–84. https://doi.org/10.1016/j.fcr.2011.06.007
Fahad, S., Bajwa, A. A., Nazir, U., Anjum, S. A., Farooq, A.; Zohaib, A., Sadia, S.; Nasim,
W., Adkins, S., Saud, S., Ihsan, M. Z., Alharby, H., Wu, C., Wang, D., & Huang, J. (2017). Crop production under drought and heat stress: plant responses and management options. Frontiers in Plant Science, 8, 1–16. https://doi.org/10.3389/fpls.2017.01147
Fahlgren, N., Gehan, M. A., & Baxter, I. (2015). Lights, camera, action: High-throughput plant phenotyping is ready for a close-up. Current Opinion in Plant Biology, 24, 93–99. https://doi.org/10.1016/j.pbi.2015.02.006
FAOSTAT. (2019). Production/Yield quantities of Sorghum in World (Rome). Faostat. http://www.fao.org/faostat/en/#data/QC/visualize
Faye, A., Sine, B., Chopart, J.-L., Grondin, A., Lucas, M., Diedhiou, A. G., Gantet, P., Cournac, L., Min, D., Audebert, A., Kane, A., & Laplaze, L. (2019). Development of a model estimating root length density from root impacts on a soil profile in pearl millet (Pennisetum glaucum (L.) R. Br). Application to measure root system response to water stress in field conditions. PLOS ONE, 14(7), e0214182. https://doi.org/10.1371/journal.pone.0214182
Foster, A. J., Kakani, V. G., & Mosali, J. (2017). Estimation of bioenergy crop yield and N status by hyperspectral canopy reflectance and partial least square regression. Precision Agriculture, 18, 192–209. https://doi.org/10.1007/s11119-016-9455-8
Fracasso, A., Trindade, L., & Amaducci, S. (2016). Drought tolerance strategies highlighted by two Sorghum bicolor races in a dry-down experiment. Journal of Plant Physiology, 190, 1–14. https://doi.org/10.1016/j.jplph.2015.10.009
Gano, B., Dembele, J. S. B., Ndour, A., Luquet, D., Beurier, G., Diouf, D. & Audebert, A. (2021). Using UAV Borne, Multi-Spectral Imaging for the Field Phenotyping of Shoot Biomass, Leaf Area Index and Height of West African Sorghum Varieties under Two Contrasted Water Conditions. Agronomy, 11(850), 1–20. https://doi.org/10.3390/agronomy11050850
Gano, B., Dembele, J. S. B., Tovignan, T. K., Sine, B., Vadez, V., Diouf, D., & Audebert, A. (2021). Adaptation responses to early drought stress of West Africa sorghum varieties. Agronomy, 11(3), 1–21. https://doi.org/10.3390/agronomy11030443
Girma, F., Mekbib, F., Tadesse, T., Menamo., T., & Bantte, K. (2020). Phenotyping sorghum [Sorghum bicolor (L.) Moench] for drought tolerance with special emphasis to root angle. African Journal of Agricultural Research, 16(8), 1213–1222.
Gregory, P. J. (2006). Roots, rhizosphere and soil: the route to a better understanding of soil science? European Journal of Soil Science, 57(1), 2–12. https://doi.org/10.1111/j.1365- 2389.2005.00778.x
Hadebe, S. T., Modi, A. T., & Mabhaudhi, T. (2017). Drought tolerance and water use of cereal crops: A focus on sorghum as a food security crop in sub-Saharan Africa. Journal of Agronomy and Crop Science, 203(3), 177–191. https://doi.org/10.1111/jac.12191
Harris, K., Subudhi, P. K., Borrell, A., Jordan, D., Rosenow, D., Nguyen, H., Klein, P., Klein, R., & Mullet, J. (2007). Sorghum stay-green QTL individually reduce post- flowering drought-induced leaf senescence. Journal of Experimental Botany, 58(2), 327–338. https://doi.org/10.1093/jxb/erl225
Henry, A. (2013). IRRI’s drought stress research in rice with emphasis on roots: accomplishments over the last 50 years. Plant Root, 7, 92–106. https://doi.org/10.3117/plantroot.7.92
Hu, P., Chapman, S. C., Wang, X., Potgieter, A., Duan, T., Jordan, D., Guo, Y., & Zheng, B. (2018). Estimation of plant height using a high throughput phenotyping platform based on unmanned aerial vehicle and self-calibration: example for sorghum breeding. European Journal of Agronomy, 95, 24–32. https://doi.org/10.1016/j.eja.2018.02.004
Hud, A. A.; Abuali, A. I.; Elnahsikh, M. H.; Ahmed, M. I.; Idris, A. E.; Farah, A. M.; Ali, H. A., Mohamed, B., & Babiker, A. E.; Mohamed, E. A. (2016). Effect of water stress on vegetative growth, yield and yield components of sweet sorghum (Sorghum bicolor L.) genotypes. Environment and Natural Resources International Journal (ENRIJ), 1(1), 33–38. https://www.sudanknowledge.org/download/033-38-2016
Intergovernmental Panel on Climate Change. (2014) Climate Change 2013—The Physical Science Basis: Working Groupo I Contribution to the Fifth Assessment Report of the Intergovernmental Panel on Climate Change. Cambridge University Press. https://doi.org/10.1017/CBO9781107415324
Iqbal, F., Lucieer, A., & Barry, K. (2018). Simplified radiometric calibration for UAS- mounted multispectral sensor. European Journal of Remote Sensing, 51(1), 301–313. https://doi.org/10.1080/22797254.2018.1432293
Jaleel, C. A., Gopi, R., & Panneerselvam, R. (2008). Growth and photosynthetic pigments responses of two varieties of Catharanthus roseus to triadimefon treatment. Comptes Rendus Biologies, 331(4), 272–277. https://doi.org/10.1016/j.crvi.2008.01.004
Kapanigowda, M. H., Perumal, R., Djanaguiraman, M., Aiken, R. M., Tesso, T., Prasad, P. V. V., & Little, C. R. (2013). Genotypic variation in sorghum [Sorghum bicolor (L.) Moench] exotic germplasm collections for drought and disease tolerance. SpringerPlus, 2(1), 1–13. https://doi.org/10.1186/2193-1801-2-650
Kholová, J., Hash, C. T., Kakkera, A., Kočová, M., & Vadez, V. (2009). Constitutive water- conserving mechanisms are correlated with the terminal drought tolerance of pearl millet [Pennisetum glaucum (L.) R . Br .]. 61(2), 369–377. https://doi.org/10.1093/jxb/erp314
Kholová, J., Hash, C. T., Kumar, P. L., Yadav, R. S., Kočová, M., & Vadez, V. (2010).
Terminal drought-tolerant pearl millet [Pennisetum glaucum (L.) R. Br.] have high leaf ABA and limit transpiration at high vapour pressure deficit. Journal of Experimental Botany, 61(5), 1431–1440. https://doi.org/10.1093/jxb/erq013
Levitt, J. (1985). Review of responses of plants to environmental stresses. Journal of Range Management, 38(5), 480. https://doi.org/10.2307/3899731
Li, J., Shi, Y., Veeranampalayam-Sivakumar, A.-N., & Schachtman, D. P. (2018).
Elucidating sorghum biomass, nitrogen and chlorophyll contents with spectral and morphological traits derived from unmanned aircraft system. Frontiers in Plant Science, 9, 1–12. https://doi.org/10.3389/fpls.2018.01406
Lynch, J. P., Chimungu, J. G., & Brown, K. M. (2014). Root anatomical phenes associated with water acquisition from drying soil: targets for crop improvement. Journal of Experimental Botany, 65(21), 6155–6166. https://doi.org/10.1093/jxb/eru162
Magney, T. S., Eitel, J. U. H., Huggins, D. R., & Vierling, L. A. (2016). Proximal NDVI derived phenology improves in-season predictions of wheat quantity and quality.
Agricultural and Forest Meteorology, 217, 46–60. https://doi.org/10.1016/j.agrformet.2015.11.009
Masi, C. E. A., & Maranville, J. W. (1998). Evaluation of sorghum root branching using fractals. The Journal of Agricultural Science, 131(3), 259–265. https://doi.org/10.1017/S0021859698005826
Molden, D. (2007). A comprehensive assessment of water management in agriculture. In D. Molden (Ed.), Water for Food Water for Life: A Comprehensive Assessment of Water Management in Agriculture (pp. 1–40). Earthscan. https://doi.org/10.4324/9781849773799
Naoura, G., Sawadogo, N., Atchozou, E. A., Emendack, Y., Hassan, M. A., Reoungal, D.,
Amos, D. N., Djirabaye, N., Tabo, R., & Laza, H. (2019). Assessment of agro- morphological variability of dry-season sorghum cultivars in Chad as novel sources of drought tolerance. Scientific Reports, 9(1), 1–12. https://doi.org/10.1038/s41598-019- 56192-6
Ndiaye, M., Adam, M., Muller, B., Guissé, A., & Cissé, N. (2018). Performances agronomiques et stabilité phénotypique de génotypes de Sorgho (Sorghum bicolor (L.) Moench) au Sénégal: une étude des interactions. Journal of Applied Biosciences, 125(2018), 12617–12629. https://doi.org/https://doi.org/10.4314/jab.v125i1.10
Ndiaye, M., Adam, M., Ganyo, K. K., Guissé, A., Cissé, N., & Muller, B. (2019). Genotype- environment interaction: Trade-offs between the agronomic performance and stability of dual-purpose sorghum (Sorghum bicolor L. Moench) genotypes in Senegal. Agronomy, 9(12), 867. https://doi.org/10.3390/agronomy9120867
Nonami, H. (1998). Plant water relations and control of cell elongation at low water potentials. Journal of Plant Research, 111, 373–382.
Oukarroum, A., Madidi, S. E., Schansker, G., & Strasser, R. J. (2007). Probing the responses of barley cultivars (Hordeum vulgare L.) by chlorophyll a fluorescence OLKJIP under drought stress and re-watering. Environmental and Experimental Botany, 60(3), 438–446. https://doi.org/10.1016/j.envexpbot.2007.01.002
Passioura, J. B. (1977). Grain yield, harvest index, and water use of wheat. Journal of the Australian Institute of Agricultural Science, 43, 117–120. http://hdl.handle.net/102.100.100/302777?index=1
Perrier, L., Rouan, L., Jaffuel, S., Clément-Vidal, A., Roques, S., Soutiras, A., Baptiste, C., Bastianelli, D., Fabre, D., Dubois, C., Pot, D., & Luquet, D. (2017). Plasticity of sorghum stem biomass accumulation in response to water deficit: a multiscale analysis from internode tissue to plant level. Frontiers in Plant Science, 8, 1–14. https://doi.org/10.3389/fpls.2017.01516
Peyrano, G., Taleisnik, E., Quiroga, M., de Forchetti, S. M., & Tigier, H. (1997). Salinity effects on hydraulic conductance, lignin content and peroxidase activity in tomato roots. Plant Physiology and Biochemistry, 35(5), 387–393.
Qazi, H. A., Rao, P. S., Kashikar, A., Suprasanna, P., & Bhargava, S. (2014). Alterations in stem sugar content and metabolism in sorghum genotypes subjected to drought stress. Functional Plant Biology, 41(9), 954–962. https://doi.org/10.1071/FP13299
R Core Team. (2020). R: A Language and Environment for Statistical Computing; R Foundation for Statistical Computing: Vienna, Austria. http://www.r-project.org/
Ray, D. K., Mueller, N. D., West, P. C., & Foley, J. A. (2013). Yield trends are insufficient to double global crop production by 2050. PLOS ONE, 8(6). https://doi.org/10.1371/journal.pone.0066428
Reynolds, M., & Langridge, P. (2016). Physiological breeding. Current Opinion in Plant Biology, 31, 162–171. https://doi.org/10.1016/j.pbi.2016.04.005
Richards, R. A., Rebetzke, G. J., Condon, A. G., & van Herwaarden, A. F. (2002). Breeding opportunities for increasing the efficiency of water use and crop yield in temperate cereals. Crop Science, 42(1), 111–121. https://doi.org/10.2135/cropsci2002.0111
Salack, S., Muller, B., Gaye, A. T., Hourdin, F., & Cisse, N. (2012). Analyses multi-échelles des pauses pluviométriques au Niger et au Sénégal. Science et Changements Planétaires—Secheresse, 23(1), 3–13. https://doi.org/10.1684/sec.2012.0335
Salekdeh, G. H., Reynolds, M., Bennett, J., & Boyer, J. (2009). Conceptual framework for drought phenotyping during molecular breeding. Trends in Plant Science, 14(9), 488–496. https://doi.org/10.1016/j.tplants.2009.07.007
Samborski, S. M., Gozdowski, D., Walsh, O. S., Lamb, D. W., Stępień, M., Gacek, E. S., & Drzazga, T. (2015). Winter wheat genotype effect on canopy reflectance: Implications for using NDVI for in-season nitrogen topdressing recommendations. Agronomy Journal, 107(6), 2097–2106. https://doi.org/10.2134/agronj14.0323
Sanchez, P. A. (2002). Soil Fertility and Hunger in Africa. SCIENCE, 295.
Shi, Y., Murray, S. C., Rooney, W. L., Valasek, J., Olsenholler, J., Pugh, N. A., Henrickson, J., Bowden, E., Zhang, D., & Thomasson, J. A. (2016). Corn and sorghum phenotyping using a fixed-wing UAV-based remote sensing system. In J. Valasek & J. A. Thomasson (Eds.), Autonomous Air and Ground Sensing Systems for Agricultural Optimization and Phenotyping. SPIE Digital library. https://doi.org/10.1117/12.2228737
Sinclair, T. R., & Ludlow, M. M. (1986). Influence of soil water supply on the plant water balance of four tropical grain legumes. Australian Journal of Plant Physiology, 13(3), 329–341. https://doi.org/10.1071/PP9860329
Sinclair, T. R., Pradhan, D., & Shekoofa, A. (2018). Inheritance of limited-transpiration trait in peanut: an update. Journal of Crop Improvement, 32(2), 281–286. https://doi.org/10.1080/15427528.2017.1420000
Steven, M. D., Malthus, T. J., & Baret, F. (2015). Toward standardization of vegetation indices. In P. S. Thenkabail (Ed.), Remotely sensed data characterization, classification, and accuracies (pp. 175–193). CRC Press. https://doi.org/10.1201/b19294
Strauss, A. J., Krüger, G. H. J., Strasser, R. J., & Van Heerden, P. D. R. (2006). Ranking of dark chilling tolerance in soybean genotypes probed by the chlorophyll a fluorescence transient O-J-I-P. Environmental and Experimental Botany, 56(2), 147–157. https://doi.org/10.1016/j.envexpbot.2005.01.011
Taiwo, F. A., Daramola, O., Sow, M., & Semwal, V. K. (2020). Ecophysiology and responses of plants under drought. In M. Hasanuzzaman (Ed.), Plant Ecophysiology and Adaptation Under Climate Change: Mechanisms and Perspectives I: General Consequences and Plant Responses (pp. 231–268). Springer. https://doi.org/10.1007/978-981-15-2156-0
Tardieu, F. (1988). Analysis of the spatial variability of maize root density—I. Effect of wheel compaction on the spatial arrangement of roots. Plant and Soil, 107(2), 259–266. https://doi.org/10.1007/BF02370555
Tari, I., Laskay, G., Takács, Z., & Poór, P. (2013). Response of sorghum to abiotic stresses: A review. Journal of Agronomy and Crop Science, 199(4), 264–274. https://doi.org/10.1111/jac.12017
Tingting, X., Peixi, S., & Lishan, S. (2010). Photosynthetic characteristics and water use efficiency of sweet sorghum under different watering regimes. Pakistan Journal of Botany, 42(6), 3981–3994.
Vadez, V., Hash, T., Bidinger, F. R., & Kholova, J. (2012). Phenotyping pearl millet for adaptation to drought. Frontiers in Physiology, 3, 1–12. https://doi.org/10.3389/fphys.2012.00386
Venuprasad, R., Lafitte, H. R., & Atlin, G. N. (2007). Response to direct selection for grain yield under drought stress in rice. Crop Science, 47(1), 285–293. https://doi.org/10.2135/cropsci2006.03.0181
Verma, R., Kumar, R., & Nath, A. (2018). Drought resistance mechanism and adaptation to water stress in sorghum [Sorghum bicolor (L.) Moench]. International Journal of Bio- resource and Stress Management, 9(1), 167–172. https://doi.org/10.23910/ijbsm/2018.9.1.3c0472
Yu, N., Li, L., Schmitz, N., Tian, L. F., Greenberg, J. A., & Diers, B. W. (2016).
Development of methods to improve soybean yield estimation and predict plant maturity with an unmanned aerial vehicle-based platform. Remote Sensing of Environment, 187, 91–101. https://doi.org/10.1016/j.rse.2016.10.005
Zegada-Lizarazu, W., & Monti, A. (2013). Photosynthetic response of sweet sorghum to drought and re-watering at different growth stages. Physiologia Plantarum, 149(1), 56–66. https://doi.org/10.1111/ppl.12016
Zhang, Z., Masjedi, A., Zhao, J., & Crawford, M. M. (2017). Prediction of sorghum biomass based on image-based features derived from time series of UAV images. IEEE International Geoscience and Remote Sensing Symposium (IGARSS), 6154–6157. https://doi.org/10.1109/IGARSS.2017.8128413
