6 Consumer Willingness to Pay for Millet-based Food Attributes in Niger
Abstract
This chapter assesses urban consumers’ preference for quality attributes of value-added food products derived from cereals. We combine qualitative and quantitative methods to assess the preferences of 205 randomly sampled consumers and derive their willingness to pay for those quality attributes. We account for taste and preference heterogeneity inherent in consumers’ responses to a change in quality attributes. Consumers are sensitive to health quality attributes as measured by the expiration date, the presence of a micronutrient, and the product’s country of origin. The resulting market demand for quality-improved products suggests the marketing of novel attributes through a promotion strategy that includes quality labeling to improve product differentiation.
Keywords: labeling, expiration date, fortification, choice experiment
Introduction
Several studies show that nutrition and safety information positively affect consumers’ food choices, depending on whether they are price conscious or not (Chowdhury et al., 2011; Drichoutis et al., 2005; Lusk and Schroeder, 2004; Nayga et al., 1998). The introduction of new or improved food quality attributes has a primary goal of a market differentiation of the product from competing ones and creates new market segments (Henson & Reardon, 2005; Roy & Srivastava, 2022). Indeed, income growth and relative price changes also induce a gradual shift toward processed foods in developing countries (Barrett et al., 2017). Successful introduction of an improved or a new food product requires a deep understanding of consumers’ preferences and valuation of intrinsic and extrinsic attributes. Hence, knowing consumers’ willingness-to-pay (WTP) for food attributes is critical to achieve effective policy intervention. Furthermore, it provides information about the market demand of those attributes to food processors for strategic marketing and segmentation (Caswell & Mojduszka, 1996).
Another important consideration is that consumers consider price premiums the most decisive limiting factor cereal products demand in West Africa (Naseem et al., 2013). For example, high premiums combined with limited availability might restrict market growth, especially in populations that need these micronutrients (O’Donovan & McCarthy, 2002). Therefore, WTP estimates can analyze the marketability of new products and develop Pareto-improving public policy where warranted (Van Loo et al., 2011).
Several studies investigated consumers’ preferences for food quality attributes in developing countries. For example, biofortification of micronutrients (e.g., zinc, pro-vitamin A, or iron) translates to substantial premiums in Uganda, Ethiopia, and Senegal (Chowdhury et al., 2011). Fiamohe et al. (2015) conducted a study in West Africa on extrinsic and intrinsic characteristics finding that Togolese consumers are willing to pay a premium of up to 46% of the actual price for cleanliness and 53% for whiteness in locally produced rice.
This chapter presents the results of a framed choice experiment to determine the relative values of food product fortification and marketing information. The study assesses consumers’ preferences for intrinsic (i.e., the expiration date on products, the dietary composition of iron in food) and extrinsic (i.e., family-friendly promotion and country-of-origin) characteristics of high-quality millet flour-based agglomerated cereal products. This chapter explicitly models consumers’ marginal rate of substitution of income for quality attributes, accounting for preference heterogeneity across consumers, using mixed multinomial logit models in both preference and WTP spaces proposed by Train and Weeks (2004) and Scarpa et al. (2008). We applied these models to consumer data elicited from a collective conjoint-based choice experiment conducted in the capital of Niger. Our contribution to the literature and policy debate is twofold. First, in the global debate on the implications of date labeling for food waste, we evaluate consumers’ valuation of expiration dates. Second, we assess the relevance of accounting for preference heterogeneity in evaluating consumer valuation of quality attributes. Additionally, we provide empirical evidence for a plausible market-driven micronutrient supply through fortified food products in developing countries.
Choice Experiment Methods
We evaluated a random sample of 205 consumers WTP for quality attributes of value-added cereal food product locally known as Dèguè which is an agglomerated food product, similar to couscous, but of a larger diameter.1 Traditionally it has been marketed as a homogenous food commodity and developed for subsistence purposes. However, some small firms, owned mainly by women, use modern technologies to produce high-quality products, especially in urban areas. Quality characteristics of those products are not made explicit to consumers in a way that can be directly analyzed through market purchases to determine relative demand for these quality attributes. As such, this experiment has been conducted to determine consumers’ preferences for selected quality attributes embedded in these food products.
Packages of five hundred grams (500 g) of Dèguè with varying quality attributes are the unit of analysis. Because the products with these quality attributes were either new or unavailable in the local market, demand for the attributes was uncertain. Consequently, this study represents a classical use of Choice Experiments (CE) to determine relative preference for the product attributes and estimate the associated marginal WTP (Louviere, 1991). Revealed preference data —groceries or scanner data—often estimate WTP in high or middle-income countries. Such data are not readily available in Niger, where grocery stores with electronic scanning systems are at an early stage of development. Also, Lusk and Schroeder (2004) noted the difficulty of finding survey participants in such studies adding to the challenge of collecting demographic characteristics from each purchaser of Dèguè in a store setting. It may not be possible to identify market niches by classifying consumers with the same preference structure.
Hence, random participants who were going to, or returning from the market, were recruited on the spot. To include a random factor during sampling, we approached every fifth male or female passer-by with an estimated age between 18 and 65. Following the methods of Demont et al. (2012), whenever we approached a group, we selected a maximum of one participant so that none of the participants knew each other. Subjects were offered 2000 FCFA ($4) cash to participate in “Consumers’ willingness to pay for quality attributes of cereal value-added food products,” a study conducted in a schoolroom near the market site. We assigned participants a random identification number for anonymity and directed them to the experiment site. One and a half hour sessions occurred once or twice per day, depending on the difficulty of recruiting participants, between July 4 and July 10, 2017. The experiment was conducted in the five districts of Niamey to ensure the spatial representativeness of the sample to the city population.
Prior to the focus group discussion on May 30, 2017, we conducted a literature review and reviewed expert interviews to identify the main drivers of consumer food choices. As a result, ten attributes were selected for the focus group discussion, including: price and brand, food safety, ecological certification, production process, health-related characteristics, and nutritional attributes. Through a series of pre-tests and expert advice, subsequent refinement led to four customized and improved attributes (Figure 1).
Upon arrival at the session, subjects completed a short demographic questionnaire and examined a packaged sample of Dèguè made locally by processors in town without labels. An information sheet and cheap talk script were read aloud, after which subjects responded to a series of eight repeated questions on product choice. Each question or choice set appeared on the board, read aloud in French, and translated into the two major languages of Hausa and Djerma, which are spoken in the town.
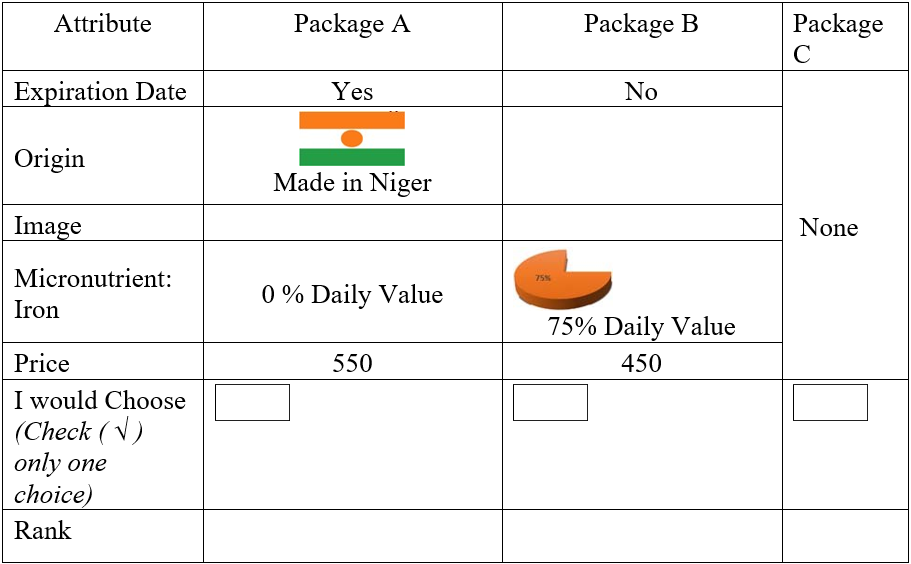
Three package options (Figure 2) were presented to the subjects in each set, including a “None of these” option. Subjects were asked to indicate which package was preferred (or none) in each scenario. Package price ranged between 450 FCFA, 500 FCFA, 550 FCFA, and 600 FCFA. During focus group discussions, the price levels were chosen to straddle the range of prices available in the market.
Figure 1
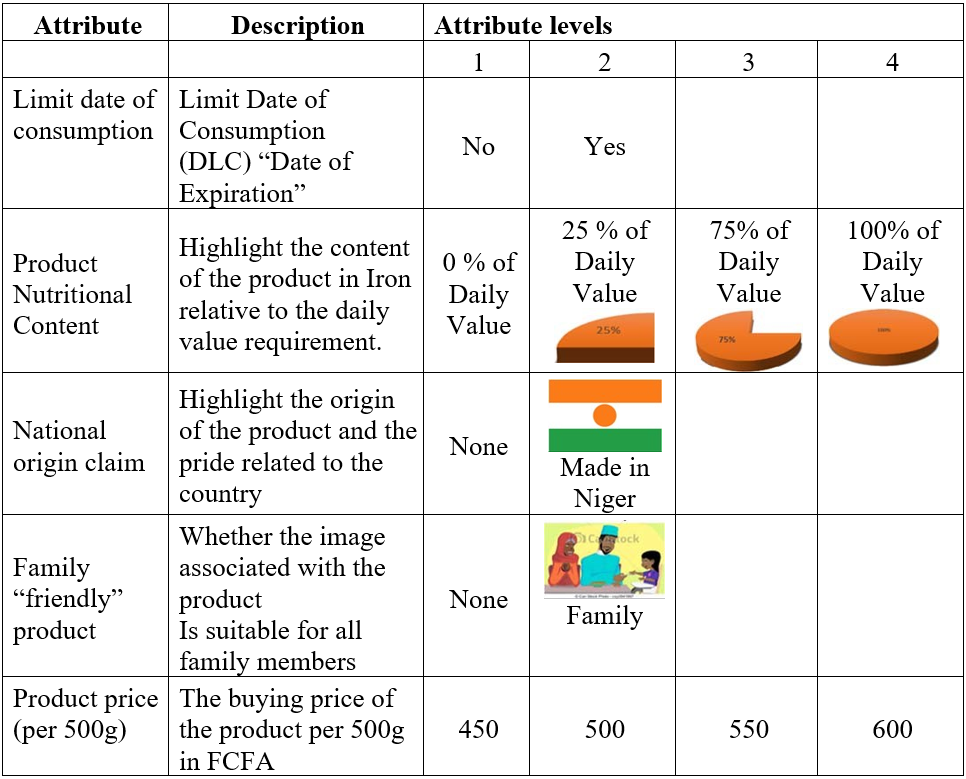
In this experimental design, there are three options of packages (including none) built using four price levels, micronutrient content levels, country-of-origin declaration, and a modern family image (See Figure 1). Subjects would have to be shown 22 × 22 × 22 × 42 × 42 = 16,384 different choice sets if presented with every package at every combination of price, micronutrient level, date of expiration, the origin of the product, and family image. An orthogonal fractional of the full factorial design was generated to reduce the number of questions respondents had to answer. In this design, attributes are uncorrelated between packages. The resulting design consisted of 64 sets of scenarios or choice sets, which were then formed into eight blocks of eight choice sets each. An example choice card is presented in Figure 2.
Figure 2
Empirical Methodology
Consider a consumer’s utility maximization problem under a budget constraint, with an exogeneous level of a good’s quality (q). In the case of agribusiness applications, q is most applicable as a measurement or index of a good’s quality (Lusk & Hudson, 2004). The consumer chooses the market good (xm) that maximizes utility, producing the traditional Marshallian demand curve xm(p, y, q), where p is the market price of the good and y is income. The resulting indirect utility function is V (p, y, q). Now assume that an agribusiness food processor and retailer consider improving the quality of an existing product from q0 to q1. A measurement of the consumer’s value on this improvement can be derived by determining the magnitude of a WTP such that the following equality holds: V (p, y – WTP, q1) = V (p, y, q0). WTP measurement is often conducted using a Choice Experiment (CE) composed of hypothetical sets of questions for novel products or attributes without an existing market.
In each CE question or choice set, respondents had to choose between two packages and the “none of these” option. Let Vnjt be the deterministic component of nth consumer’s utility of choosing package j at choice occasion t. For simplicity, the utility derived from alternative j chosen by consumer n at choice occasion t is separable in price and quality (non-price attributes) xnjt,:
Unjt = –αnpricenjt +βnxnjt + unjt, j=A, B, C (1)
where scalar αn is the price coefficient, and vector βn represents the marginal utility associated with the quality attributes. Both sets of parameters vary randomly by consumer n = 1, …, N., unjt is the stochastic component of utility that is Gumbel distributed with a variance Var(unjt) = μn2(π2/6), and µn is the scale parameter for consumer n. Train and Weeks (2004) demonstrated that the scale of utility is irrelevant to consumer behavior. The utility can then be divided by µn without changing behavior, which results in an i. i. d. new error term εnjt of type-one extreme value, distributed with constant variance (π2/6):
Unjt = λnpricenjt + c’nxnjt + εnjt (2)
where λn = –αn/µn and cn = βn/µn. Train and Weeks (2004) call this specification the “utility model in preference space.” It can be seen from Equation 2 that λn and cn are correlated unless the scale parameter does not vary over individuals since µn appears in the denominator in both expressions. Specifying the coefficients to be independent implies that the random term is homoscedastic, which may not be a realistic assumption. By using the fact that the WTP is given by wn= –βn/αn = cn/λn, Equation 2 can be written as:
Unjt = λn[pricenjt + wn xnjt] + εnjt (3)
This model is what Train and Weeks (2004) and Scarpa et al. (2008) called “utility in WTP space.” Models (2) and (3) are, of course, behaviorally equivalent. However, the key thing to note is that a standard assumption regarding λn and cn in the preference space (equation 2) can lead to an unusual distribution for the WTP. For instance, if the price coefficient has any positive density setting over zero, then the distribution of this ratio has undefined moments (Daly et al., 2012). In addition, if λn and cn are both normally distributed, it implies that wn is a ratio of two normal distributions, which does not have defined moments. This choice of distribution is unlikely if we were to specify the distribution for the WTP directly as we did in the WTP space model. We estimated the coefficients in the preference space and WTP space models using maximum-simulated likelihood. We followed Scarpa et al. (2008) as described in the next section.
Estimation Method
This section presents the method of estimating coefficients in equations 2 and 3. We adopt the mixed logit specification under repeated choices by consumers with continuous taste known as panel mixed logit developed by Revelt and Train (1998). In our study, consumer n faces a choice among j alternatives (package A, Package B, or C-Neither) in each T choice situation. For the simplicity of the exposition, let θn represent the random terms entering utility, which are λn and cn in the preference space (equation (2)) and λn and wn in the WTP space (equation (3)).
Consumer n chooses package j in period t if Unjt ≥ Unkt ∀j ≠ k. Denote the consumer’s chosen alternative in choice occasion t as ynt. The consumer sequence of choice over the Tn choice occasions t as yn=⟨yn1,…,ynTn⟩. Hence, conditional on θn, consumer’s n sequence of choice probability is:
 (4)
(4)
The unconditional probability of consumer n‘s sequence of choice is the integral over all values of θn weighted by its density
 (5)
(5)
where f(.) is the density of θn, which depends on parameters Ω* to be estimated. The goal is to estimate Ω*, which is the population parameter that describes the distribution of individual parameters (Revelt & Train, 1998) using the log-likelihood function LL(Ω) = ∑nlnPn(Yn|Ω*). The exact maximum likelihood is not possible since the integral of equation (4) cannot be calculated analytically. Hence Pn(Yn|Ω*) is approximated via simulation. The simulation is done by first drawing a θr values of θn from f(θn|Ω*) with Ω* fixed at a given initial value.
With a given R number of draws:  =
=  is an unbiased estimator of Pn(Yn|Ω*). Finally, substitute
  into the Log-Likelihood function to yield the simulated Log-Likelihood:
 where dnjt = 1 if consumer n chooses alternative j at choice situation t.
In this study, we first estimated a range of models in both preference and WTP space and afterward selected the “best” model among a set of non-nested models using the Akaike likelihood Ratio Index proposed by Ben-Akiva and Swait (1986). We compute Akaike Likelihood Ratio Index (ALRI) for each model to measure how well the models best fit the data. We chose the model with significantly higher ALRI1.
RESULTS
1. Descriptive Statistics
Table 1 presents sampled consumer distributions concerning gender, age groups, marital status, education, and their corresponding average household monthly expenditure group. The table also compares our sample structure with our target population at the city and national levels, even though our survey was exclusively in Niamey. These comparisons were chosen because the generalization of the findings will critically depend on the sample representativity of the targeted population: consumers between 18- and 60-years old living in the city of Niamey. Our sample distribution was also compared to the national level to understand similarities and differences between the sample and the target population. Specifically, our sample is stratified concerning the town districts and has similar spatial distributions as our targeted population. Overall, the randomization appeared to be well-conducted since our sample is relatively representative of consumers in Niamey. In addition, this similarity is extended to the national level despite some noticeable dissimilarities for education and marital status variables. When the city sample is compared to the national level population, consumers without any level of education are underrepresented in our sample.
Specifically, 17.5% of our sample had no education, which is low compared to the 47.7% for the city of Niamey and 73.4% for the national level. The reticence in participating in the survey may concern a lack of trust in the recruiter and the delivered message. Finally, a noticeable fact is a discrepancy about the top and bottom classes of participants’ household food expenditures in Niamey. The low-income class is overrepresented, while the higher class is underrepresented in our sample. This situation is probably due to the incentives we proposed (US $4), which is 25% of the average monthly food expenditure in our sample. This may be a significant incentive for the lower-income group, but not for the higher-income group.
Like Niamey and the national level, our typical consumer is relatively young, between 18 and 34 years old, married, with a monthly food expenditure of fewer than 12,000 FCFA (USD 22), and lives in a household with 6-8 members. Specifically, about two-thirds of the participants have a monthly food expenditure level of fewer than 16,000 FCFA (USD 29).2
Regarding food poverty, 36.5% of the participants live in households with a per capita food expenditure lower than the town threshold, calculated to be 9,925 FCFA (USD 18) per capita per month by official statistical services (INS, 2011). Comparatively, the chronic food insecurity estimated by the National Institute of Statistics was 33.5%.
| Sample | Niamey | Diff. Sample-Naimeya | t-stat | National | Diff. Sample Nationalb | t-stat | |
| (1) | (2) | (3) | (4) | (5) | |||
| Gender | |||||||
| Male | 42.27 | 48.91 | -6.64*** | -2.70 | 49.37 | -7.1*** | 2.60 |
| Female | 57.73 | 51.09 | -8.82*** | -2.70 | 50.63 | -8.36*** | 2.60 |
| Age Group | |||||||
| 18-24 years | 25.26 | 27.27 | -2.01* | -1.92 | 23.99 | 1.27 | -0.86 |
| 25-34 years | 27.32 | 29.74 | -2.42* | -.032 | 28.12 | -0.8 | 0.16 |
| 35-44 years | 24.23 | 17.5 | 6.73* | 1.91 | 18.35 | 5.88 | 1.64 |
| 45-54 years | 14.95 | 12.99 | 1.96 | 0.40 | 13.87 | 1.08 | 0.07 |
| 55-64 years | 6.19 | 7.81 | -1.62 | 0.30 | 9.06 | -2.87 | -0.30 |
| 65 years or + | 2.06 | 4.99 | -2.93 | 0.31 | 6.61 | -4.55 | -0.84 |
| Marital Status | |||||||
| Single | 33.51 | 35.11 | -1.6 | -0.56 | 19.26 | 14.25*** | 4.77 |
| Married | 60.82 | 55.68 | 5.14 | 1.51 | 71.78 | -10.96*** | -2.87 |
| Divorced | 4.12 | 3.8 | 0.32 | 0.09 | 2.64 | 1.48*** | -15.37 |
| Widow | 1.55 | 5.37 | -3.82* | -1.74 | 6.01 | -4.46*** | -60.37 |
| Education | |||||||
| None | 17.53 | 47.7 | -30.17*** | -10.62 | 73.41 | -55.88 | -19.64 |
| Primary | 24.23 | 22.04 | 2.19*** | -26.40 | 13.47 | 10.76 | -15.58 |
| Junior High | 24.23 | 14.54 | 9.69*** | 2.52 | 7.43 | 16.8 | 5.06 |
| Senior High | 10.31 | 2.72 | 7.59** | 2.84 | 1.07 | 9.24 | 7.16 |
| Professional | 5.67 | 4.5 | 1.17 | -1.38 | 1.91 | 3.76 | 3.93 |
| Koranic | 8.25 | 0.8 | 7.45 | -0.39 | 0.23 | 8.02 | 3.11 |
| Higher Education | 8.25 | 7.6 | 0.65 | 0.40 | 2.42 | 5.83 | 2.87 |
| Other | 1.53 | 0.1 | 1.43*** | 3.39 | 0.06 | 1.47 | 3.59 |
| Per capita monthly household food expenditure (FCFA)c | |||||||
| Less than 4000 | 10.4 | 0.66 | 9.74 | 0.40 | 1.89 | 8.51*** | 2.77 |
| 4000-6000 | 10.98 | 1.76 | 9.22** | 2.00 | 7.47 | 3.51 | -1.46 |
| 6000-8000 | 12.14 | 5.29 | 6.85 | 1.50 | 13.30 | -1.16** | -2.33 |
| 8000-10000 | 12.14 | 9.14 | 3.00 | 0.43 | 16.39 | -4.25* | -2.77 |
| 10000-12000 | 4.62 | 9.03 | -4.41 | 0.71 | 14.78 | -10.16* | -1.76 |
| 12000-14000 | 6.94 | 10.46 | -3.52 | 0.32 | 12.53 | -5.59 | -0.54 |
| 14000-16000 | 9.25 | 11.23 | -1.98** | 2.33 | 9.15 | 0.1 | 3.05 |
| More than 16000 | 33.53 | 52.42 | -18.89*** | 24.48 | 9.05 | 1.38 | |
Note. *** p<0.01, **p<0.05, * p<0.1, with p the p-value of the one-sample t-test. a is the difference between Niamey and the sample estimate, b represents the difference between national and the sample estimate, c Per capita monthly household food expenditure (FCFA). Niamey and National level information are official statistics by the National Institute of Statistics.
2. Estimated Model Parameters
In this section, we compare results from the estimated choice models. The models are estimated using maximum simulated likelihood with 1000 Halton draws. Table 2 presents estimation results for both preference and WTP spaces models as discussed in the methodology. In both spaces, models are estimated across random utility coefficients. The first two columns are the estimation results of models in preference space (Equation 2) without and with the correlation between estimated coefficients, respectively. The two last columns display estimation results of models in the WTP space, again without and with the correlation between the estimated coefficients.
| Preference Space | WTP Space | |||
| Without correlation | With correlation | Without correlation | With correlation | |
| (1) | (2) | (3) | (4) | |
| Price | -0.006*** | -0.006*** | -5.090*** | -4.930*** |
| (0.0005) | (0.000551) | (0.0986) | (0.0896) | |
| Expiration date | 1.638*** | 1.709*** | 276.2*** | 242.6*** |
| (0.108) | (0.123) | (20.40) | (17.81) | |
| Micronutrient (less than 25 % of DR) | 0.387*** | 0.400*** | 65.20*** | 63.60*** |
| (0.0461) | (0.0526) | (7.789) | (8.428) | |
| Product origin | 0.752*** | 0.737*** | 122.0*** | 138.3*** |
| (0.107) | (0.121) | (15.12) | (16.61) | |
| Family image | 0.129 | 0.0908 | 19.1 | 41.07** |
| (0.109) | (0.122) | (18.12) | (18.60) | |
| L* at Convergence | -1136.574 | -1104.79 | -1135.927 | -1093.286 |
| Akaike Information Criterion | 2299.148 | 2265.58 | 2299.853 | 2256.572 |
|
ρj2
|
-1.24 | -1.18 | -1.24 | -1.16 |
|
Pr(ρ42-ρj2)
|
0 | 0 | 0 | a |
|
Pr(ρ22-ρj2)
|
0 | a | 0 | b |
| Observations | 4272 | 4272 | 4272 | 4272 |
Note. Standard errors in parentheses, *** p<0.01, **p<0.05, * p<0.1, a Probabilities are not calculated because of the auto-comparison. b The statistics are not computed because
| Observation | Expiration Date | Micronutrient | Origin | Family Image | |
| All Classes | 4272 | 242.6*** | 63.60*** | 138.3*** | 41.07** |
| (17.81) | (8.428) | (16.61) | (18.60) | ||
| Gender | |||||
| Male | 2,520 | 203.4*** | 62.24*** | 147.8*** | 44.53* |
| (19.05) | (10.39) | (20.01) | (23.52) | ||
| Female | 1,752 | 317.4*** | 70.82*** | 132.4*** | 49.69 |
| (40.31) | (16.17) | (28.66) | (35.92) | ||
| Monthly Income Classa | |||||
| Less than 60 | 888 | 297.6*** | 32.40* | 145.2*** | 66.29 |
| (40.51) | (17.63) | (33.89) | (44.67) | ||
| 60-120 | 1368 | 226.2*** | 55.05*** | 203.3*** | 92.84* |
| (46.50) | (19.22) | (45.11) | (51.36) | ||
| More than 120 | 2,016 | 225.2*** | 84.89*** | 104.0*** | 30.75 |
| (24.08) | (12.17) | (22.20) | (24.07) | ||
| Age | |||||
| Less than 28 years old | 1,704 | 249.8*** | 41.08*** | 114.7*** | 28.05 |
| (21.71) | (10.54) | (20.46) | (23.10) | ||
| 28-38 years old | 1,104 | 221.9*** | 89.24*** | 151.4*** | 77.59** |
| (18.38) | (10.78) | (30.60) | (35.44) | ||
| More than 38 years old | 1,464 | 266.7*** | 51.34*** | 185.1*** | 44.61 |
| (35.42) (15.64) (32.04) (40.10) | |||||
Note. Standard errors in parentheses, *** p < 0.01, ∗ ∗ p < 0.05, * p < 0.1, with p the p − value. aIncome class in thousands of FCFA
The fit of alternative models of heterogeneity was compared using the Akaike Likelihood Ratio Index because the models estimated are non-nested. In addition, based on this index, a test procedure developed by Ben-Akiva and Swait (1986) was implemented to test the statistical difference of fit between models. The general result is that the model in WTP space with correlation outperforms all others because the probability of incorrectly specified functional form is almost equal to zero, as shown in the lower panel of Table 3. The result strongly suggests the suitability of its structure in explaining consumers’ preferences in our sample case and is the basis of subsequent model interpretation. Also, the fact that preference heterogeneity exists is evident by the improvement in the likelihood of the model with random parameters from that with fixed random parameters. Appendix A provides details on the model selection procedure.
3. Robustness Analysis
We further test model performance by bifurcating the total sample into two subsets containing 80 and 20 percent of the sample. We drew one hundred iterations with replacement and models estimated using 80 percent of the sample. The resulting parameters predicted the results for the 20 percent held aside. Then we compared the predicted choice with the actual choice to calculate the out-of-sample prediction success rate. We did this to test the model’s predictive ability and to determine a preferred model based on comparing success rates.
The cumulative probability distribution curves allowed us to illustrate the distribution of correct predictions for the out-of-sample selection for each of the four models. These results are presented in figure 3. A distribution to the right indicates a higher prediction rate for a given probability. We used these tests to determine whether models with correlation (or not) better predict choice and whether models in preference space out predict those in willingness-to-pay space. Overall, models have had little difference in terms of predictive power since the prediction rate is around 74 percent for all four models; however, those with a correlation between coefficients have had a slightly higher success rate (Table D.1). As a result, models equally perform well in an out-of-sample setting. No curve first-order or second-order dominates another, indicating that no model better predicts the out-of-sample choice.
Figure 3
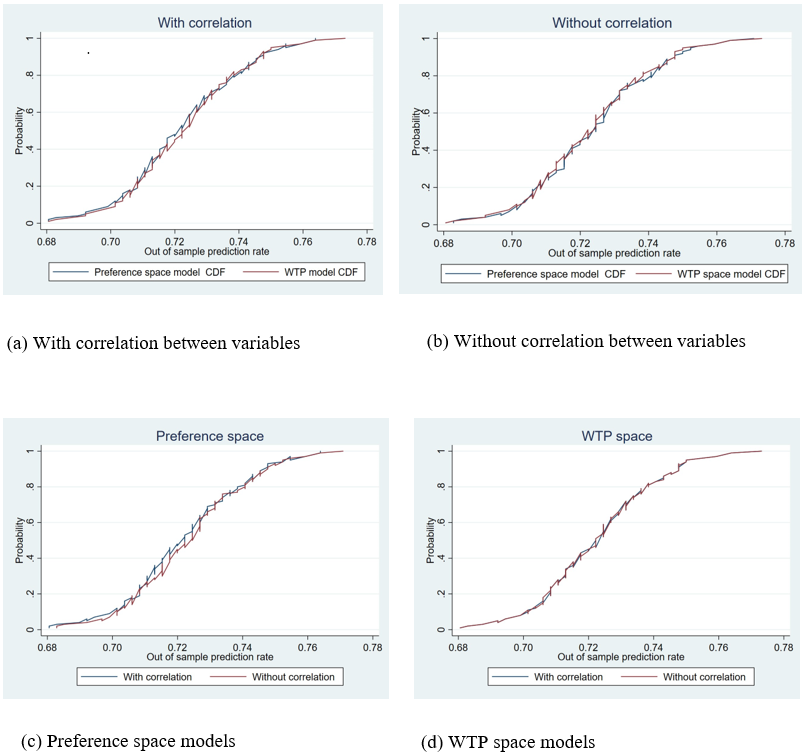
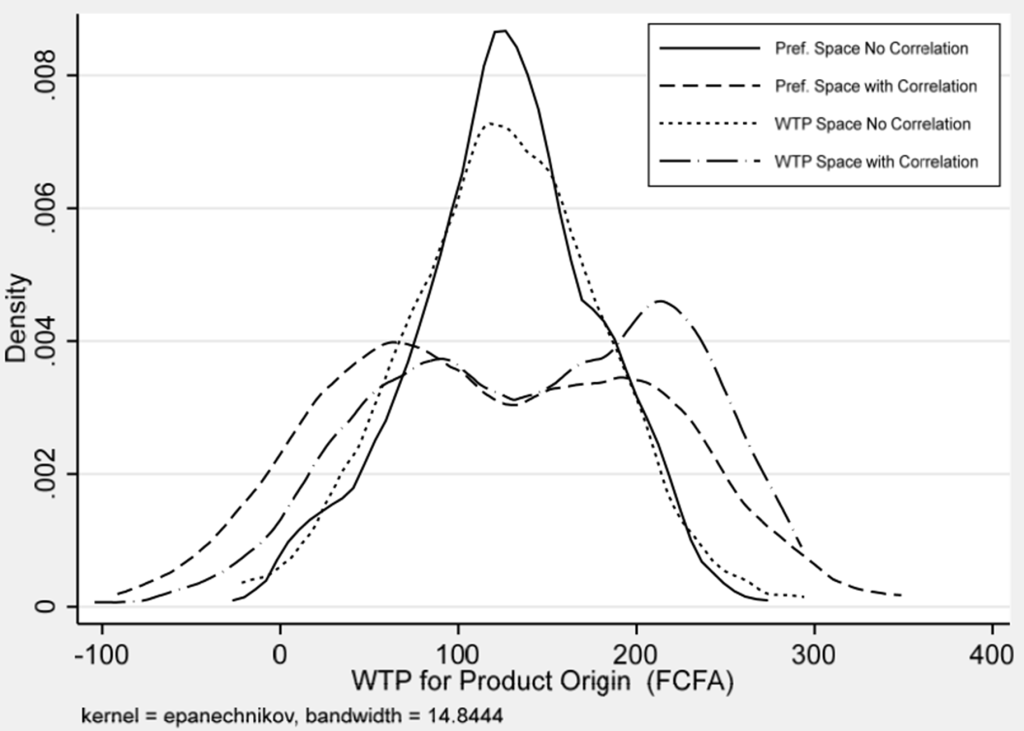
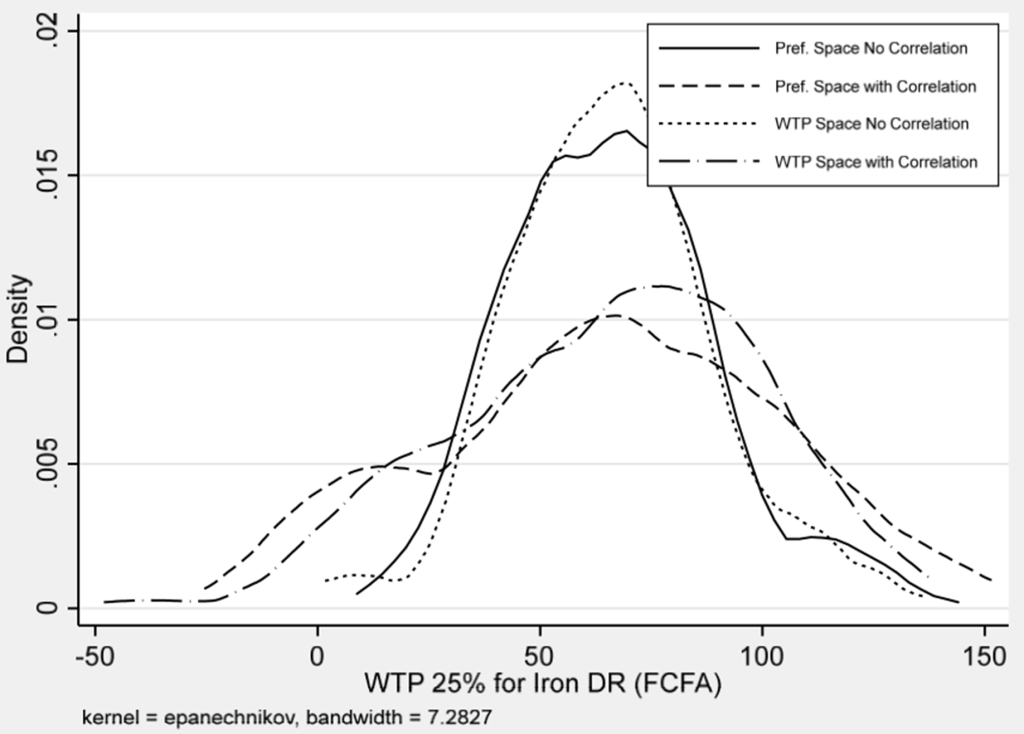
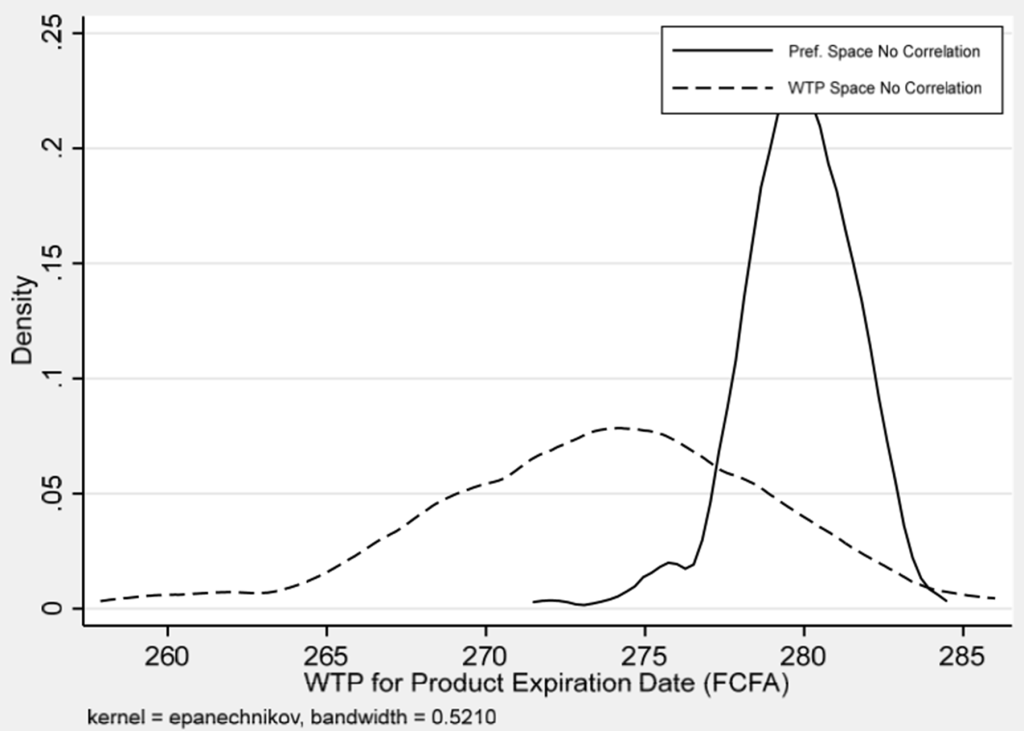
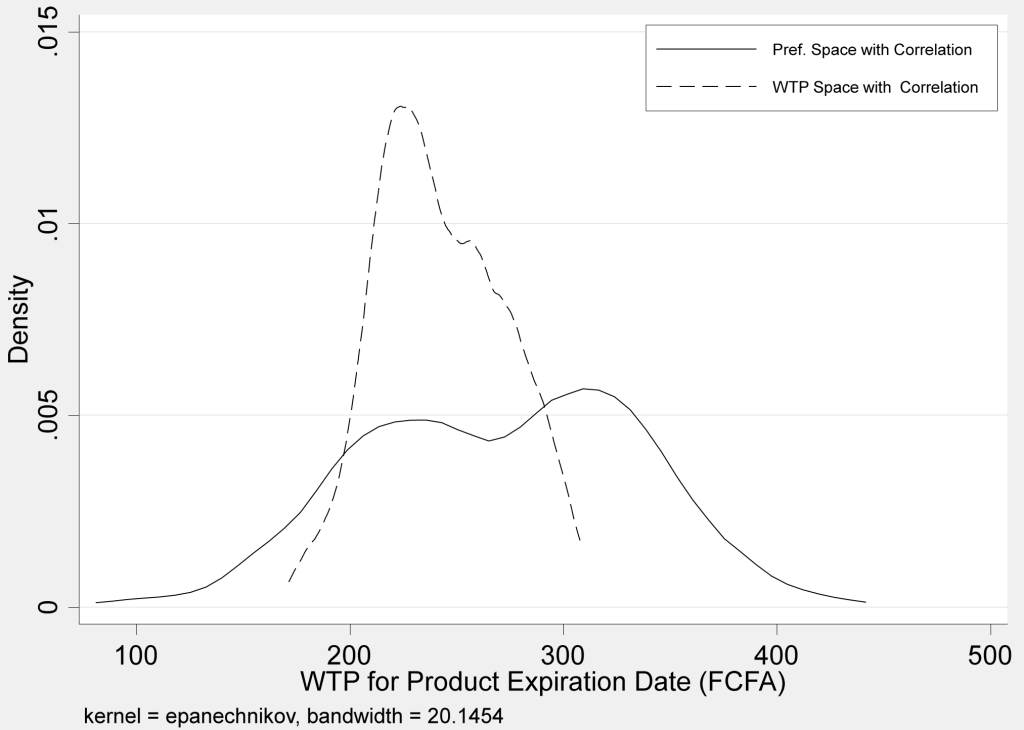
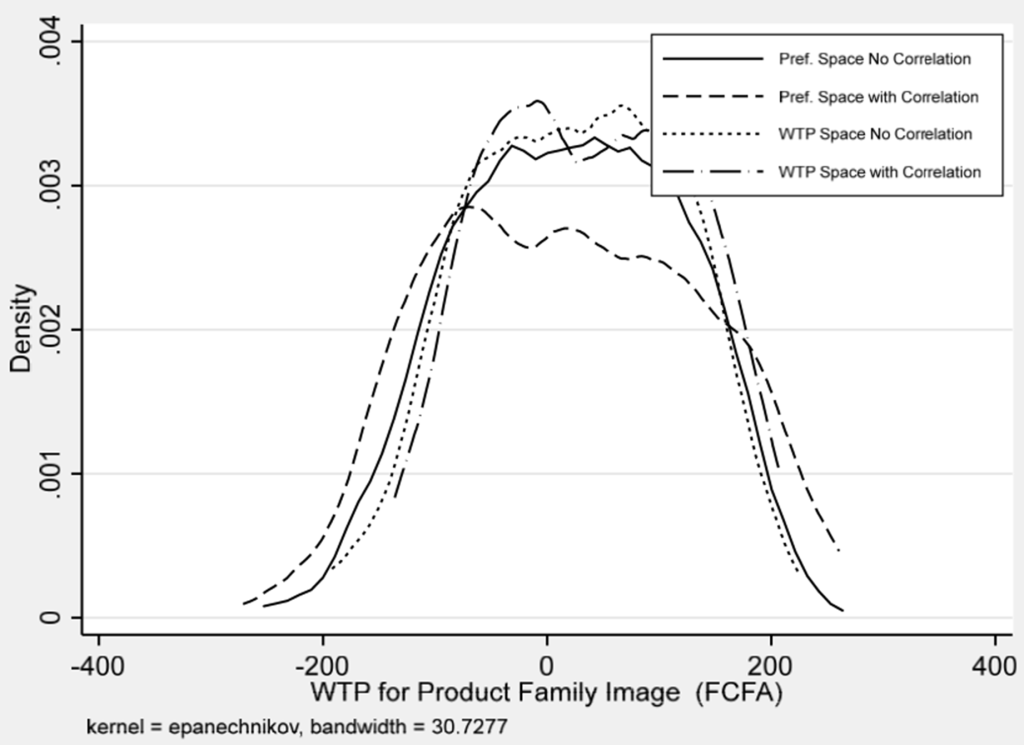
Figure 4 presents the posterior distributions of parameter estimates. These graphs emphasize the range of heterogeneity of consumer valuation of the product’s intrinsic and extrinsic traits under alternative specifications. Since there are interesting spread and multimodal distributions, we attempt to explain these phenomena by disaggregating models into market segments to enhance understanding of the robustness of these models.
Figures 4a-4e Individual Posterior Means Distributions of Marginal WTPs Across Sample Respondents
4. Parameter Interpretation and Heterogeneity
All models produced reasonable estimates. The price coefficient is negative, while consumers strongly prefer the expiration date, micronutrient information, and the product’s origin. The family image attribute is less critical, although significant. Also, all standard deviations associated with the marginal utilities of attributes are statistically significant at the one percent level, denoting significant preference heterogeneity of consumers concerning attributes. The expiration date, which informs consumers about a product’s safety for consumption, increases utility by 1.7 (Column 3). As a result, consumers are willing to pay a premium of 242.6 FCFA for this attribute or information. Initially, the result of 242.6 FCFA seemed to be an implausibly large value since it is roughly 1/3 of the average producer price of the product. Nevertheless, this high value may reveal a consumer’s WTP to avoid expenditure on an outdated and unhealthy product. Several studies highlight this strong social desirability of food safety and calls for labelling policy (Liu et al., 2020; Wongprawmas & Canavari, 2017).
The second-most important attribute is micronutrients—the percentage of daily iron requirements or daily value—needed by a human body. The willingness to pay for 25% of the Recommended Dietary Allowance (RDA) of iron is 65 FCFA. Since micronutrients have three levels, WTP for one additional daily requirement level will be linear because our experimental design does not allow for estimating nonlinear effect by integrating dummy variables representing each level. As a result, the willingness to pay for 50%, 75%, and 100% of daily requirements could be estimated as equal to 127 FCFA, 191 FCFA, and 254 FCFA, respectively. Nevertheless, 25% of RDA for 500g of the product is a technological threshold since iron taste is distinguishable above that level, possibly confounding consumer taste and preference.
Table 3 and Figure 5 present the marginal WTP for attributes by income classes, and gender, using the utility model in WTP space with the correlation between the marginal utility of attributes. The product’s origin is the third attribute consumers strongly prefer. They are willing to pay a premium of 138 FCFA for the product to be made in their country rather than an uncertain place of origin. Women have a strong preference for iron content and the product’s expiration date, making them more inclined to pay a higher premium for those attributes. This situation is not surprising because the team nutritionist highlighted the benefit for pregnant and lactating women, and their babies, in the “Cheap Talk Information” given to the participants.
Figure 5
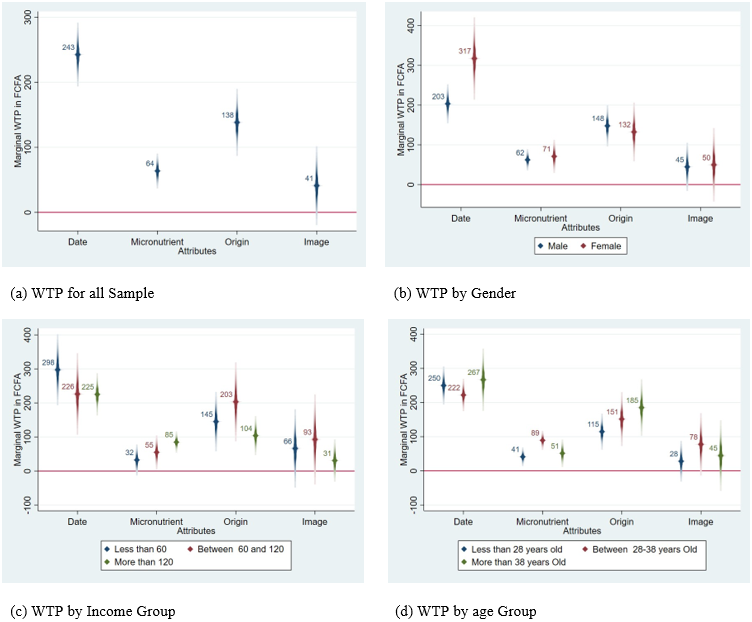
Men strongly prefer “Made in Niger” and the expiration date, which translates to higher WTP than women. Also, younger consumers are even more ethnocentric than older ones based on their willingness to pay a higher premium for products that carry an image of the Nigerien flag. The willingness to pay for the expiration date is higher for low-income classes and lower for higher-income classes. This finding suggests that risk-averse consumers are willing to pay a higher premium to purchase a product with a more certain quality as defined by the expiration date in WTP space.
Finally, consistent with Bennett’s law on the relationship between income and food quality, WTP for micronutrients is significantly higher for higher-income classes of consumers. Indeed, Bennett’s law reflects the seemingly universal desire for variety in diet and diversification towards higher quality.
Discussion and Conclusion
Our study focuses on urban consumers in one of the poorest nations in the world. The hypothetical market setting provides information on a range of intrinsic and extrinsic attributes of the food product. Our experiment’s design provided signals to consumers on product freshness, as described by the date of expiration, nutritional content, as described by the micronutrient density, the national origin of the product, and family friendliness as described by the family image. Specifically, we inferred consumer demand for product safety through a statistically significant WTP for a product that bears a date of expiration compared to a product that does not have such information. In these treatments, consumers showed a strong preference for the quality attributes compared to the situations where they were uncertain on attributes. Also, consumers strongly prefer products made in their home country.
These results reveal how consumers may react when they are certain about product information when making food choices. This finding indicates the value of transforming credence attributes into search attributes through labeling. The uncertainty reduction drives a higher willingness to pay for product-related attributes. Furthermore, consumers are willing to pay a price premium for iron fortification. These results are consistent with theoretical predictions derived by Falconi and Row (1990) in their study on the economics of food safety. They show that consumers’ beliefs, the certainty of beliefs, and the presence of information (signals), are important determinants of demand for goods as the demand for health drives them.
The attributes and the information provided to participants enhanced those beliefs. In addition, the effectiveness of how information is supplied to consumers has been crucial on consumers’ WTP. For example, the low level of micronutrient WTP may be related to consumer-limited knowledge of its health benefit. Consumers widely understand the date of expiration or product origin, which is not the case with micronutrients. Hence, participants may be uncertain about any associated health benefit. Aside from these results, findings are heterogeneous across socioeconomic characteristics, such as gender and income class, which segments the market.
Because market demand is high for health-related attributes such as date of expiration, public policy could be undertaken to create an enabling environment for the supply of such attributes. This policy could first sensitize food processors on the economic benefit of following quality standards and informing consumers on those attributes. This information could be provided to consumers using harmonized and high-quality labels and packaging. High-quality labels are critical in developing consumer trust in the claimed attributes. Furthermore, governments could set guidelines on the type of label that food processors should adopt. Several countries already implement such guidelines in West Africa following FAO and WHO (2010) Codex Alimentarius Commission standards.
In addition, our study suggests that micronutrient demand is higher in wealthier income classes and for women. This finding is consistent with Abdulai and Aubert (2004), who found that in Tanzania, the diets of high-income households were richer in all micro-and macronutrients. Likewise, Ecker and Qaim (2011) generally found that higher household incomes were associated with a more diversified diet in Malawi as measured by the number of different food items consumed.
Our findings suggest that micronutrient demand, especially by women and higher-income classes, in addition to necessary policies, may reduce malnutrition. Those critically in need of such micronutrients are less willing to pay for them mainly because of financial constraints and a lack of information on short and long-term health benefits. Government intervention may be necessary to achieve the optimal provision of such attributes. This kind of intervention could target those most in need, such as women in low-income classes. However, this approach could be costly for the entire population, mainly when based on income. Indeed, such an intervention would require records of all consumers, ultimately deciding who could benefit from the intervention or who could not. Instead of income targeting, gender targeting seems easier to implement and could have the highest return per dollar invested because pregnant and non-pregnant women of childbearing age are the most in need of iron.
Finally, our study found that consumers are likely to be ethnocentric, especially younger consumers, when purchasing processed food products. This is consistent with findings by Jin et al. (2015) in their study on consumers’ preference for a product image representing a country of origin. One explanation of this result is that with increased globalization and economic development, consumers in low-income countries may have realized that locally produced products are becoming increasingly competitive with imported products. This finding is important for food processors from both high and low-income nations because they have the opportunity to exploit and support the country associated with their companies. Therefore, such research remains of significant relevance to international agribusiness (Chabowski et al., 2013).
This study has some limitations that could be considered in future research. First, the quality issue of alternatives in each choice set is essential for avoiding any problem of price endogeneity. For example, a high price of an alternative could be interpreted as a signal of a higher quality product. Omitting the quality aspect in choice experiments could cause biased and inconsistent estimates, potentially inducing sign flipping of coefficients, especially the price. One solution is to build the quality aspect in the choice experiment by selecting choice sets for which price will be positively correlated with quality. In addition, to better manage the choice experiment, especially in developing countries, it may be helpful to have fewer attributes, and limited levels since the number of choice sets could impose power requirements of a larger sample size to detect effects.
Acknowledgements
This study was made possible by the support of the American People provided to the Feed the Future Innovation Lab for Collaborative Research on Sorghum and Millet through the United States Agency for International Development (USAID). The contents are the authors’ sole responsibility and do not necessarily reflect the views of USAID or the United States Government. Program activities are funded by the United States Agency for International Development (USAID) under Cooperative Agreement No. AID-OAA-A-13-00047.
References
Abdulai, A., & Aubert, D. (2004). A cross-section analysis of household demand for food and nutrients in Tanzania. Agricultural Economics, 31(1), 67–79.
Barrett, C. B., Christian, P., & Shiferaw, B. A. (2017). The structural transformation of African agriculture and rural spaces: Introduction to a special section. Agricultural Economics, 48(S1), 5–10.
Ben-Akiva, M., & Swait, J. (1986). The Akaike likelihood ratio index. Transportation Science, 20(2), 133–136.
Caswell, J. A., & Mojduszka, E. M. (1996). Using informational labeling to influence the market for quality in food products. American Journal of Agricultural Economics, 78(5), 1248– 1253.
Chabowski, B. R., Samiee, S., & Hult, G. T. M. (2013). A bibliometric analysis of the global branding literature and a research agenda. Journal of International Business Studies, 44(6), 622–634.
Chowdhury, S., Meenakshi, J., Tomlins, K. I., & Owori, C. (2011). Are consumers in developing countries willing to pay more for micronutrient-dense biofortified foods? Evidence from a field experiment in Uganda. American Journal of Agricultural Economics, 93(1), 83–97.
Daly, A., Hess, S., & Train, K. (2012). Assuring finite moments for willingness to pay in random coefficient models. Transportation, 39(1), 19–31.
Demont, M., Rutsaert, P., Ndour, M., Verbeke, W., Seck, P. A., & Tollens, E. (2012). Experimental auctions, collective induction and choice shift: Willingness-to-pay for rice quality in Senegal. European Review of Agricultural Economics, 40(2), 261–286.
Drichoutis, A. C., Lazaridis, P., & Nayga, R. M. (2005). Nutrition knowledge and consumer use of nutritional food labels. European Review of Agricultural Economics, 32(1), 93–118.
Ecker, O., & Qaim, M. (2011). Analyzing nutritional impacts of policies: An empirical study for Malawi. World Development, 39(3), 412–428.
Falconi, C., & Roe, T. (1990). Economics of food and safety: Risk, information, and the demand and supply of health. University of Minnesota – Economic Development Center. https://ageconsearch.umn.edu/record/7456/files/edc90-01.pdf
Fiamohe, R., Nakelse, T., Diagne, A., & Seck, P. A. (2015). Assessing the effect of consumer purchasing criteria for types of rice in Togo: A choice modeling approach. Agribusiness 31(3), 433–452.
Institute National de la Statistique du Niger (INS). (2011). Profil et determinants de la pauvrete au niger en 2011. https://www.stat-niger.org/wp-content/uploads/2020/06/Profil_Pauvrete_2011_ECVMA.pdf.
Jin, Z., Lynch, R., Attia, S., Chansarkar, B., Gulsoy, T., Lapoule, P., Liu, X., Newburry, W., Nooraini, M. S., Parente, R., Purani, K., & Ungerer, M. (2015). The relationship between consumer ethnocentrism, cosmopolitanism and product country image among younger generation consumers: The moderating role of country development status. International Business Review, 24(3), 380–393.
Henson, S., & Reardon, T. (2005). Private agri-food standards: Implications for food policy and the agri-food system. Food Policy, 30(3), 241–253.
Liu R., Gao Z., Snell H. A., & Ma, H. (2020). Food safety concerns and consumer preferences for food safety attributes: Evidence from China. Food Control, 112, 107157.
Louviere, J. J. (1991). Experimental choice analysis: Introduction and overview. Journal of Business Research, 23(4), 291–297.
Lusk, J. L., & Hudson, D. (2004). Willingness-to-pay estimates and their relevance to agribusiness decision making. Applied Economic Perspectives and Policy, 26(2), 152–169.
Lusk, J. L., & Schroeder, T. C. (2004). Are choice experiments incentive compatible? A test with quality differentiated beef steaks. American Journal of Agricultural Economics, 86(2), 467–482.
Naseem, A., Mhlanga, S., Diagne, A., Adegbola, P. Y., & Midingoyi, G. S.-k. (2013). Economic analysis of consumer choices based on rice attributes in the food markets of west Africa—the case of Benin. Food Security, 5(4), 575–589.
Nayga, R. M., Lipinski, D., & Savur, N. (1998). Consumers’ use of nutritional labels while food shopping and at home. Journal of Consumer Affairs, 32(1), 106–120.
O’Donovan, P., & McCarthy, M. (2002). Irish consumer preference for organic meat. British Food Journal, 104(3/4/5), 353–370.
Revelt, D., & Train, K. (1998). Mixed logit with repeated choices: Households’ choices of appliance efficiency level. Review of Economics and Statistics, 80(4), 647–657.
Roy, V., & Srivastava, S. K. (2022). The safety–quality dominant view of food chain integrity: Implications for consumer‐centric food chain governance. International Journal of Management Reviews, 24(1), 3–24.
Scarpa, R., Thiene, M., & Train, K. (2008). Utility in willingness to pay space: A tool to address confounding random scale effects in destination choice to the alps. American Journal of Agricultural Economics, 90(4), 994–1010.
Train, K., & Weeks, M. (2004). Discrete choice models in preference space and willingness-to pay space. Cambridge Working Papers in Economics, 1–16. https://doi.org/10.17863/CAM.5151
Van Loo, E. J., Caputo, V., Nayga, R. M., Meullenet, J.-F., & Ricke, S. C. (2011). Consumers’ willingness to pay for organic chicken breast: Evidence from choice experiment. Food Quality and Preference, 22(7), 603–613.
World Health Organization (WHO). (2010). Nutrition landscape information system (nlis) country profile indicators: Interpretation guide. https://apps.who.int/iris/handle/10665/44397
Wongprawmas, R., & Canavari, M. (2017). Consumers’ willingness-to-pay for food safety labels in an emerging market: The case of fresh produce in Thailand. Food Policy, 69, 25–34.
Appendix A. Model Selection Test Procedure
In order to test the appropriateness of alternative specifications, we applied the test on non-nested choice models, which was based on the AIC proposed by Ben-Akiva and Swait (1986). The test proceeded as follows. Assume that there are two models (model 1 and model 2). Model 1 explains choices using K1 variables and model 2 explains the same choices using K2 variables. Assume that the models are different either by their functional form or by the number of variables. The fitness measured is defined as follows:

where Lj is the log (simulated) likelihood for model j = 1,2. The denominator L(0) is the log-likelihood for a model—multinomial logit in our case—with constant only. Under the null hypothesis that model 2 is the true model, its fitness measure will be higher. More importantly, the difference between the two fitness measures of both models is:

where Z is the difference of the fitness measures between models. This probability was calculated for all the pairwise combinations of models 2 and 3 estimated with and without correlation. Using the above definition, we calculated that the probability that model 2 under correlation of the coefficients is incorrectly specified functional form is almost equal to zero, as shown in Table 2.
Appendix B. Survey Materials
Appendix B.1. Questions on Choice Experiment
Imagine you are purchasing a package of Dèguè at your local store or market. You can choose between two packages of Dèguè that Package A and B. Package A has a date of expiration on it so that you know if it is expired or not. Package B did not have this information that is you do not know if it is expired or not. In addition, on package A has a Family picture on while package B does not. Package A has zero percent of iron daily requirement in that is it does not contain iron micronutrient to satisfy your body daily requirement. By contrast, Package B contains iron that represents 75% (three quarters) of your body daily requirement. But to have Package A you must pay 550FCFA and to have package B you must pay 450. If you choose package A, check the corresponding box; if you decide to choose package B check its corresponding Box. If you do not prefer package A nor B then check the box corresponding to package C.
Appendix B.2. Information on Micronutrient (Iron)
Iron is important and effects red cell production in quantity and quality, the productivity that comes from having good quality blood, the relationship of a healthy pregnant woman to have a healthy baby, role in the prevention of anemia allows the brain to function properly, allows a good growth and learning skills of the child, prevent certain diseases of the liver and pancreas, etc. Without enough iron, your body can’t produce enough of a substance in red blood cells that enables them to carry oxygen. As a result, iron deficiency anemia may leave you with the following symptoms: extreme fatigue, weakness, pale skin, chest pain, fast heartbeat or shortness of breath, cold hands and feet, headache, dizziness or light-headedness, poor appetite, especially in infants and children with iron deficiency anemia. One of the causes of a lack of iron is in your diet. Your body regularly gets iron from the foods you eat. If you consume too little iron, your body can become iron deficient over time. Examples of iron-rich foods include meat, eggs, leafy green vegetables, and iron-fortified foods. For proper growth and development, infants and children also need iron from their diets. Women, infants, and children are at greater risk of iron deficiency anemia. Infants, especially those who were low birth weight or born prematurely, who don’t get enough iron from breast milk or formula, may be at risk of iron deficiency. Children need extra iron during growth spurts. If your child isn’t eating a healthy, varied diet, he or she may be at risk of anemia.
Appendix B.3. Cheap Talk Script
We are here today to conduct a study on your preferences for millet products. In particular, we want to know how you will react if we give you information on the Dèguè. We will give you information about two packets of Dèguè and ask you what you will choose. Your answers will be anonymous. At the end of the study, you will be paid an amount of 2000 FCFA for your time.
In addition, the information we gather from this study will be very useful in designing an appropriate labeling and promotion strategy that will improve the sales of women producing this product and also the nutrition of the population. Therefore, it is important that you understand the experience and think carefully before making your answers. In a recent study, several different groups of people were asked whether they would purchase a new food product similar to the one you are about to be asked about. This purchase was hypothetical for these people, as it will be for you. No one actually had to pay money when they indicated a particular preference. The results of this study were that over 80% of people said they would buy the new food. However, when a store actually put the same new food on their shelf, but where payment was real and people really did have to pay money if they decided to purchase the new food, the results were that only 43% of people actually bought the new food. That’s quite a difference, isn’t it? We call this “hypothetical bias.” Hypothetical bias is the difference that we continually see in the way people respond to hypothetical purchase questions as compared to real situations.
Why this is so? In my opinion when you go to the market and wants to buy a product, you have a limited budget to make purchases for you or your household. You really think twice before spending your money, so you don’t waste your money buying something that you or your household doesn’t need. This is what is happening in the real life. But in the hypothetical life you may think that you really don’t lose money or since you don’t have to eat the product you are more inclined to make a decision that may not represents what you will do in real market. So, if I were in your place, I would ask myself: if I was really shopping at the local store or market and I had X FCFA to purchase a package of Dèguè, do I really want to spend X FCFA to have package A or Y to have package B? If the answer is yes in either of the cases, check the corresponding box and left blank the other cases. If the answer is no in both of the cases, check the last box. In any case, I ask you to respond to each of the following purchase questions just exactly as you would if you were really in a local store or market and were going to face the consequences of your decision: which is to pay money if you decide to buy a food.
Appendix C. Estimation outputs
| Expiration Date | Micronutrient | Origin | Family Image | |
| Expiration Date | 0.811*** (0.139) |
|||
| Micronutrient (25 % of DR) | -0.595*** (0.158) |
0.207** (0.0844) |
||
| Origin | -0.0457 (0.213) |
0.0904 (0.153) |
0.196 (0.188) |
|
| Family Image | 0.178 (0.654) |
0.240 (0.149) |
-0.973*** (0.192) |
-0.105 (0.534) |
Standard errors in parentheses, *** p < 0.01, ∗ ∗ p < 0.05, * p < 0.1, with p the p − value.
| Parameter | ln( λn) | Expiration Date | Micronutrient | Origin | Family Image |
| ln( λn) | -116.5*** (19.95) |
||||
| Expiration Date | 41.38* (21.69) |
-33.23*** (11.56) |
|||
| Micronutrient (25 % of DR) | 3.163 (27.68) |
0.438*** (0.105) |
-25.73 (21.30) |
||
| Origin | 1.407 (16.65) |
-82.36*** (31.01) |
0.291** (0.134) |
40.46*** (10.92) |
|
| Family Image | -85.62*** (30.37) |
0.128 (0.131) |
-42.21 (46.82) |
0.0163 (0.178) |
0.0518 (0.182) |
Standard errors in parentheses, *** p < 0.01, ** p < 0.05, * p < 0.1
Appendix D. Model robustness check using out of sample prediction rate
|
Without correlation
|
With Correlation | |||
| Preference space | WTP space | Preference space | WTP space | |
| Out of sample prediction success rate | 73.8% | 73.8% | 74.1% | 74.1% |
| Chi2 | 146.27 | 146.27 | 150.00 | 146.27 |
| p-value | 0.000 | 0.000 | 0.000 | 0.000 |
