6 Chapter 2: Unmanned Aerial Vehicles & How They Can Augment Mesonet Weather Tower Data Collection [Mai]
Student Learning Objectives
The student will gain conceptual knowledge of a Mesonet, how a Mesonet can aid in weather prediction, and how a sUAV (small Unmanned Aerial Vehicle – usually tethered up to 400 feet) can fill in holes and create a 3D Mesonet.
The student will be able to:
- Understand the Highlights of Mesonet Data collection selected weather instrument(s)
- Gain an overview of sUAV’s currently interaction with Mesonet(s)
- Explore future uses of sUAV’s for assisting Weather prediction.
What is a Mesonet? (Wikipedia, 2020)
Mesonet, is a network of automated weather and environmental monitoring stations designed to observe mesoscale meteorological phenomena. (Service, 2020) (Glickman, 2000) Dry lines, squall lines, and sea breezes are examples of phenomena that can be observed by mesonets. Due to the space and time scales associated with mesoscale phenomena, weather stations comprising a mesonet will be spaced closer together and report more frequently than synoptic scale observing networks, such as ASOS. The term mesonet refers to the collective group of these weather stations and are typically owned and operated by a common entity. Mesonets usually record in situ surface weather observations but some involve other observation platforms, particularly vertical profiles of the planetary boundary layer (PBL). (Marshall, (11 Jan 2016))
The distinguishing features that classify a network of weather stations as a mesonet are station density and temporal resolution. Depending upon the phenomena meant to be observed, mesonet stations use a spatial spacing of 1 to 40 kilometers (0.62 to 24.85 mi) (Fujita T. , 1962) and report conditions every 1 to 15 minutes. Micronets (see microscale and storm scale), such as in metropolitan areas such as Oklahoma City, (Basara, et al., 2011) may be even denser in spatial resolution. (Muller, Chapman, Grimmond, Young, & Cai, 2013)
Thunderstorms, squall lines, drylines, (Pietrycha & Rasmussen, 2004) sea and land breezes, mountain breeze and valley breezes, mountain waves, mesolows and mesohighs, wake lows, mesoscale convective vortices (MCVs), tropical cyclone and extratropical cyclone rainbands, macrobursts, gust fronts and outflow boundaries, heat bursts, urban heat islands, and other mesoscale phenomena can cause weather conditions in a localized area to be significantly different from that dictated by the ambient large-scale conditions. (Fujita T. , 1981) (Ray, 1986) As such, meteorologists need to understand these phenomena in order to improve forecast skill. Observations are critical to understanding the processes by which these phenomena form, evolve, and dissipate.[ This is where the sUAV comes into play – enhancing the data collection and reduction of chaos.]
The long-term observing networks (ASOS, AWOS, Coop),1, 2 however, are too sparse and report too infrequently for mesoscale research. ASOS and AWOS stations are typically spaced 50 to 100 kilometers (31 to 62 mi) apart and report only hourly at many sites. The Cooperative Observer Program (COOP) database consists of only daily reports. “Mesoscale” weather phenomena occur on spatial scales of tens to hundreds of kilometers and temporal (time) scales of minutes to hours. Thus, an observing network with finer temporal and spatial scales is needed for mesoscale research. This need led to the development of the mesonet.
Mesonet data is directly used by humans for decision making, but also boosts the skill of numerical weather prediction and is especially beneficial for short-range mesoscale models. Mesonets, along with remote sensing solutions (data assimilation of weather radar, weather satellites, wind profilers), allow for much greater temporal and spatial resolution in a forecast model. As the atmosphere is a chaotic nonlinear dynamical system (i.e. Butterfly effect), this increase in data increases understanding of initial conditions and boosts model performance. In addition to meteorology and climatology users, transportation departments, energy producers and distributors, other utility interests, and agricultural entities also have a need for fine scale weather information. These organizations operate dozens of mesonets within the US and globally. Environmental, emergency management and public safety, and insurance interests also are heavy users of mesonet information.
In many cases, mesonet stations may (by necessity) be located in positions where accurate measurements may be compromised; for instance, this is especially true of the stations built for WeatherBug’s network, many of which were located on school buildings. The potential bias that these locations may cause must be accounted for when entering the data into a model, lest the phenomenon of “GIGO”3 may occur.
Mesonets were born out of the need to conduct mesoscale research. The nature of this research is such that mesonets, like the phenomena they are meant to observe, are short-lived. Long term research projects and non-research groups, however, have been able to maintain a mesonet for many years. For example, the U.S. Army Dugway Proving Ground in Utah has maintained a mesonet for many decades. The research-based origin of mesonets has led to the characteristic that mesonet stations tend to be modular and portable, able to be moved from one field program to another.
Whether the mesonet is temporary or semi-permanent, each weather station is typically independent, drawing power from a battery and solar panels. An on-board computer takes readings from several instruments measuring temperature, humidity, wind speed & direction, and atmospheric pressure, as well as soil temperature and moisture, and other environmental variable deemed important to the mission of the mesonet, solar irradiance being a common non-meteorological parameter. The computer periodically saves these data to memory and transmits the observations to a base station via radio, telephone (wireless or landline), or satellite transmission. Advancements in computer technology and wireless communications in recent decades made possible the collection of mesonet data in real-time. The availability of mesonet data in real-time can be extremely valuable to operational forecasters as they can monitor weather conditions from many points in their forecast area.
Figure 2.1 A weather map consisting of a station model plot of Oklahoma Mesonet data overlaid with WSR-88D weather radar data depicting possible horizontal convective rolls as a potential contributing factor in the incipient 3 May 1999 tornado outbreak
Source: (Wikipedia, 2020)
Introduction
How does weather prediction work? Weather is extremely difficult to predict. Atmospheric conditions must be compiled around the world for a number of days monitoring such things as changes in pressure, temperature, wind speed, and rainfall. Weather balloons are sent up to take weather readings. Ships and aircraft also monitor weather data. Cloud patterns are monitored by satellite imagery. Historical data is also used to assist prediction by using variables of heat, air, and moisture in numerical modeling to see how they flow over the earth’s surface.
An examination a Mesonet Data Collection weather instrument(s).
A Mesonet is a network of environmental monitoring stations designed to measure the environment at the size and duration of mesoscale weather events. The phrase “Mesonet” is a portmanteau of the word’s mesoscale and network. One can think of Mesonet as the average occurring weather, not large scale, or microclimate without being used in combination of the before mentioned inputs to weather prediction. In this case we will concentrate on a network made up of 10-meter towers with a set of research grade weather and ground sensing instruments.
In Figure 2.2 a 30ft. weather tower is depicted. The instruments spaced at 10m are: 1 – RM Young anemometer, 1 – HMP60 temperature/relative Humidity sensor w/ radiation shield. Instruments at 2m are: 1 – RM Young anemometer, 1 – HMP60 temperature/relative Humidity sensor w/ radiation shield, 1 – CS301 Pyranometer. Midway up the tower is a 7dbi antenna. Inside the NEMA enclosure: 1 CR1000X data logger, 1 – RV50 Modem, 1 – CS106 Barometer, 1 – Charge controller.
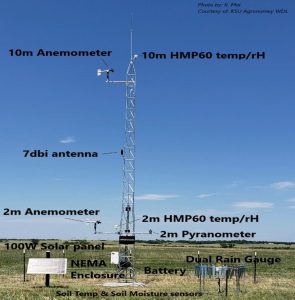
Figure 2.2: 30’ Weather Tower
Source: (Campbell Sci, 2020)
Businesses such as airlines and farming rely heavily upon accurate weather forecasting. Forecasting accurately is extremely important in keeping track of deadly weather events. That demand for accuracy places an emphasis on making proper predictions and also using high quality instrumentation that is proven to be reliable and repeatable with known calibration intervals that can be traced to know standards. We will now make an examination of the standard instrumentation used in Figure 2.2 top to bottom.
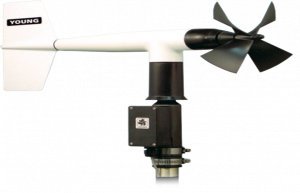
Figure 2.3: 05103 Wind Monitor
Source: (Campbell Sci, 2020)
Wind monitors, also known as Anemometers, are kinetic and require a robustness that can tolerate all weather conditions. The wind monitor show in Figure 2.3 is a lightweight, sturdy instrument for measuring wind speed and direction in your harsh environments. Its simplicity and corrosion-resistant construction make it ideal for a wide range of wind measuring applications. Manufactured by R. M. Young. The 05103 Wind Monitor is made out of rigid UV-stabilized thermoplastic with stainless steel and anodized aluminum fittings. The thermoplastic material resists corrosion from sea air environments and atmospheric pollutants. It uses stainless-steel precision-grade ball bearings for the propeller shaft and vertical shaft bearings. The 05103 measures wind speed with a helicoid-shaped, four-blade propeller. Rotation of the propeller produces an AC sine wave that has a frequency directly proportional to wind speed. The AC signal is induced in a transducer coil by a six-pole magnet mounted on the propeller shaft. The coil resides on the non-rotating central portion of the main mounting assembly, eliminating the need for slip rings and brushes. Wind direction is sensed by the orientation of the fuselage-shaped sensor body, which is connected to an internal potentiometer. The data logger applies a known precision excitation voltage to the potentiometer element. The output is an analog voltage signal directly proportional to the azimuth angle. (Campbell Sci, 2020)
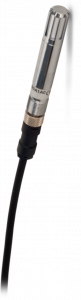
Figure 2.4: HMP60 temp/relative Humidity
Source: (Campbell Sci, 2020)
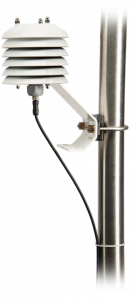
Figure 2.5: HMP60 temp/relative Humidity w/ radiation shield
Source:(Campbell Sci, 2020)
The HMP60, manufactured by Vaisala, probe measures air temperature for the range of -40° to +60°C, and relative humidity for the range of 0 to 100% RH. It uses the INTERCAP® capacitive RH chip. This field-replaceable chip eliminates the downtime typically required for the recalibration process.[4] (Campbell Sci, 2020)
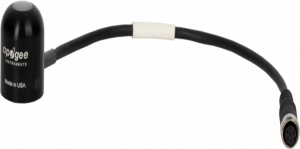
Figure 2.6: CS301 Pyranometer
Source: (Campbell Sci, 2020)
The CS301 uses a silicon photovoltaic detector mounted in a cosine-corrected head to provide solar radiation measurements. Its dome-shaped head prevents water from accumulating on the sensor head. To eliminate internal condensation, the sensor head is potted solid and the cable is shielded with a rugged Santoprene casing. The CS301 is calibrated against a Kipp & Zonen CM21 thermopile Pyranometer to accurately measure sun plus sky radiation. (Campbell Sci, 2020)
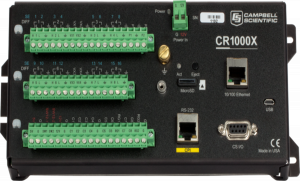
Figure 2.7: CR1000X Datalogger
Source: (Campbell Sci, 2020)
The CR1000X is a low-powered device designed to measure sensors, drive direct communication and telecommunications, analyze data, control external devices, and store data and programs in on-board, non-volatile storage. The electronics are RF-shielded and glitch-protected by a unique sealed, stainless-steel canister. A battery-backed clock assures accurate timekeeping. The on-board, BASIC-like programming language—common to all Campbell Scientific data loggers—supports data processing and analysis routines. The CR1000X wiring panel includes two switchable 12 V terminals, analog grounds dispersed among 16 analog terminals, and non pluggable terminal blocks for quick deployment. (Campbell Sci, 2020)
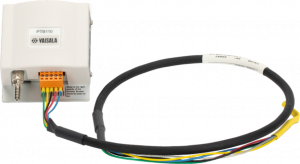
Figure 2.8: CS106 Barometer
Source: (Campbell Sci, 2020)
The CS106 uses Vaisala BAROCAP silicon capacitive sensor to measure barometric pressure. It is encased in a plastic shell (ABS/PC blend) fitted with an intake valve for pressure equilibration.
The CS106 outputs a linear signal of 0 to 2.5 Vdc, which allows the barometer to be directly connected to a Campbell Scientific data logger. An internal switching circuit allows the data logger to power the CS106 only during measurement, which reduces power consumption. (Campbell Sci, 2020)
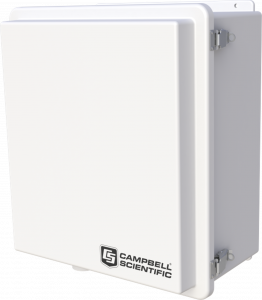
Figure 2.9: NEMA Enclosure
Source: (Campbell Sci, 2020)
Note: The Datalogger, Barometer, Charge Controller, and Modem are housed within the NEMA.
The ENC16/18 is a weather-resistant enclosure that is 16 inches wide and 18 inches tall. It can house a data logger, a power supply, and at least one peripheral. This enclosure is recommended for applications that need to have multiple communication or measurement and control peripherals housed in the same enclosure. (Campbell Sci, 2020)
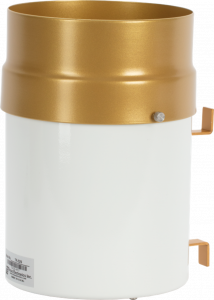
Figure 2.10 TE525 Rain Gauge
Source: (Campbell Sci, 2020)
The TE525 funnels precipitation into a bucket mechanism that tips when filled to its calibrated level. A magnet attached to the tipping mechanism actuates a switch as the bucket tips. The momentary switch closure is counted by the pulse-counting circuitry of our data loggers. (Campbell Sci, 2020)
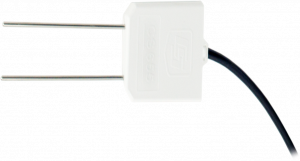
Figure 2.11: CS655 TDR Soil Moisture and Temperature
Source: (Campbell Sci, 2020)
The CS655 consists of two 12-cm-long stainless-steel rods connected to a printed circuit board. The circuit board is encapsulated in epoxy and a shielded cable is attached to the circuit board for data logger connection.
The CS655 measures propagation time, signal attenuation, and temperature. Dielectric permittivity, volumetric water content, and bulk electrical conductivity are then derived from these raw values.
Measured signal attenuation is used to correct for the loss effect on reflection detection and thus propagation time measurement. This loss-effect correction allows accurate water content measurements in soils with bulk EC ≤8 dS m-1 without performing a soil-specific calibration.
Soil bulk electrical conductivity is also calculated from the attenuation measurement. A thermistor in thermal contact with a probe rod near the epoxy surface measures temperature. Horizontal installation of the sensor provides accurate soil temperature measurement at the same depth as the water content. Temperature measurement in other orientations will be that of the region near the rod entrance into the epoxy body. (Campbell Sci, 2020)
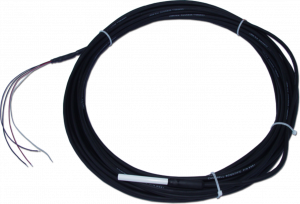
Figure 2.12: 107 Temperature probe
Source: (Campbell Sci. , 2020)
The 107 is a rugged, accurate probe that measures temperature of air, soil, or water from -35° to +50°C. It easily interfaces with most Campbell Scientific data loggers and can be used in a variety of applications. The 107 consists of a thermistor encapsulated in an epoxy-filled aluminum housing. The housing protects the thermistor, allowing you to bury the probe in soil or submerge it in water. (Campbell Sci, 2020)
Additional Components in the Weather Ground Station part of the sUAV ecosystem
Additional components needed are: A rugged modem such as a Raven RV50 w/ 4g antenna, Solar panel(s) based on power demand, deep cycle 12Vdc battery for power storage, and a charge controller for power management.
The above components are by no means the limit to the type and style of sensors and hardware that can be added to a Mesonet tower. However, they will acquire the basic data, moisture, wind speed and direction, temperature, relative humidity, barometric pressure, solar radiation, used in recording data.
A tower by itself would not be good enough to do any type of weather prediction. Even combined with multiple towers they are only good enough to record the weather at each point at any given time. As a Mesonet increases its number of towers they become more valuable. As stated before, the data collected on its own is only a record. If used in conjunction with the other forms and types of weather data collection, only then can weather prediction become possible. Even then, many holes could be filled by more towers creating more data collection points. The only way to be 100% accurate in weather prediction is to be omniscient or collect data on every square inch of the earth. Which we all understand that is economically unfeasible and a temporal impossibility.
Billions of dollars are spent each year in the recording and prediction of the weather to save lives, assist businesses and help the public with their individual daily activities. The collection of more data can only assist in that goal. But just more data is not the only requirement. Understanding that data and making inferences to establish a prediction is most important. So how do we interrupt the weather?
If a butterfly flaps its wings in Brazil, could it really cause a hurricane in Texas?
That’s more or less a spoof on the mathematics of Chaos Theory.[5] (Roulstone, 2013) To be more specific that is how we determine weather patterns. The mathematics of the known laws of motion are not good enough to predict weather. The movement of weather is so complicated it requires the use of a computer to develop models of probability. Even if you change the initial conditions only slightly the end conditions are wildly different resulting in Chaos. This is where Chaos theory becomes involved. By using contributing factors of weather, we do have models on how these variables behave. If a perfect weather prediction is impossible, then better computer computations and as many possible data points sampled would be the best we as humans can expect to strive towards. This is the point sUAV’s could help in increasing sampling points and predictive of severe weather events.
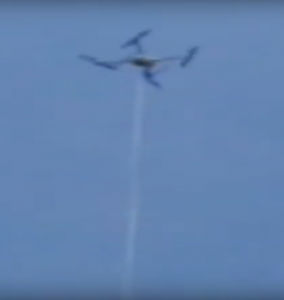
Figure 2.13 120m Tethered UAV on windy weather, cable feeder, 400VDC
Source: (Campbell Sci. , 2020)
To work with a Mesonet, a Tethered sUAV could be added and create a 3D Mesonet. Power and data could flow thru the wiring acting as a tether. This would also provide stability and retrieval.
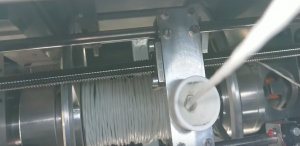
Figure 2.14: Automatic Winch to Control Tether Retrieval
Source: (Campbell Sci. , 2020)
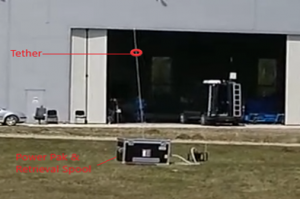
Figure 2.15: Tether Power Pak
Source: (Campbell Sci. , 2020)
Oklahoma Mesonet
The following abstract focuses on the efforts of the Oklahoma Mesonet and their efforts to design and build a 3D Mesonet with the aid of UAV’s. At the time of this writing the author is aware of only the Oklahoma Mesonet making significant funded efforts to use sUAV’s in their operations.
Fixed monitoring sites, such as those in the US National Weather Service Automated Surface Observing System (ASOS) and the Oklahoma Mesonet provide valuable, high temporal resolution information about the atmosphere to forecasters and the general public. The Oklahoma Mesonet is comprised of a network of 120 surface sites providing a wide array of atmospheric measurements up to a height of 10 m with an update time of five minutes.
The deployment of small, unmanned aircraft to collect in-situ vertical measurements of the atmospheric state in conjunction with surface conditions has potential to significantly expand weather observation capabilities. This concept can enhance the safety of individuals and support commerce through improved observations and short-term forecasts of the weather and other environmental variables in the lower atmosphere.
We report on a concept of adding the capability of collecting vertical atmospheric measurements (profiles) through the use of unmanned aerial systems (UAS) at remote Oklahoma sites deemed suitable for this application. While there are a number of other technologies currently available that can provide measurements of one or a few variables, the proposed UAS concept will be expandable and modular to accommodate several different sensor packages and provide accurate in-situ measurements in virtually all-weather conditions. Such a system would facilitate off-site maintenance and calibration and would provide the ability to add new sensors as they are developed, or as new requirements are identified. The small UAS must be capable of accommodating the weight of all sensor packages and have lighting, communication, and aircraft avoidance systems necessary to meet existing or future FAA regulations. The system must be able to operate unattended, which necessitates the inclusion of risk mitigation measures such as detect and avoid radar and the ability to transmit and receive transponder signals. Moreover, the system should be able to assess local weather conditions (visibility, surface winds, and cloud height) and the integrity of the vehicle (system diagnostics, fuel level) before takeoff. We provide a notional concept of operations for a 3D Mesonet being considered, describe the technical configuration for one station in the network, and discuss plans for future development.
Future uses of sUAV and Weather stations
As the use of UAV’s in a 3D Mesonet configuration are perfected, these same applications can be moved into situations were atmospheric gases can be sampled and quantified. For example, controlled burns in the central US could be monitored by mobile and tethered UAV’s carrying smoke canisters. The particulates from the smoke canisters can be quantified then statistically equated to the imagery of the satellites. This would allow for a close approximation to the amount of biomass consumed and the amount of CO and CO2 released into the atmosphere. This technology could be used on forest fires, oil field fires, and volcanic eruptions to quantify the number of particulates and greenhouse gases released. It would allow operators to stay at a safe distance while gathering data. A sonic anemometer could be used during the study to verify background CO2 flux and other trace gases. Done correctly, this could lead into xo-atmospheric research.
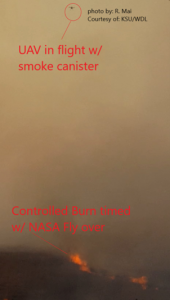
Figure 2.16: Smoke study
Source: (Randall, Mai, author courtesy of KSU/WDL)
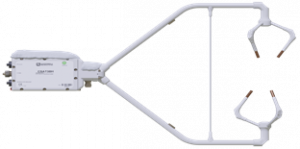
Figure 2.17: Sonic Anemometer
Source: (Tethered Pictures, 2020)
Conclusions
Civilization has come a long way since first trying to predict the weather. For example: Red sky at night sailors take delight and red sky in the morning sailors take warning. This revels clouds position of clouds at sunrise and sunset. We now have very sophisticated instruments that can take very exact readings. But those readings cannot act alone in a vacuum. And they are forever changing and changing immediately. So, the only way humans can improve weather prediction is to increase the number of readings and the profile of those readings. And then the never-ending task of making inference as to what all that data means. As we push into AI and things such as Quantum Computers we can solve more quickly the interruption of massive amounts of data. However, physically we will have to push the envelope on how to sample the never-ending pool of data the weather presents. Tethered and even mobile UAV can assist by carrying atmospheric sensors to improve the profile that we call weather and eventually climate.
Student Think Questions
- Where might we find a valuable place to deploy Tethered UAV’s?
- How can we assure powering a UAV in its role as a Tethered UAV package?
- How would you design a request for funding for a Tethered UAV?
Campbell Sci. (2020, July 02). Campbell Scientific. Retrieved from Wind Monitor – Campbell Scientific: https://www.campbellsci.com/05103-l
Campbell Sci. (2020, July 02). Campbell Scientific. Retrieved from Wind Monitor – Campbell Scientific: https://www.campbellsci.com/05103-l
References
Basara, J., Illston, B. G., Fiebrich, C. A., Browder, P. D., Morgan, C. R., McCombs, A., . . . McPherson, R. A. (2011). The Oklahoma City Micronet. Meteorological Applications, pp. 18 (3): 252–61. doi:10.1002/met.189.
Campbell Sci. (2020, July 02). Campbell Scientific. Retrieved from Wind Monitor – Campbell Scientific: https://www.campbellsci.com/05103-l
Campbell Sci. . (2020, July 2). Campbell Scientific. Wind Monitor. Retrieved from www.campbellsci.com/05103-l: https://www.campbellsci.com/05103-l
Fujita, T. (1962). A Review of Researches on Analytical Meso Meteorology. SMRP Research Paper. #8, p. Chicago: University of Chicago. OCLC 7669634.
Fujita, T. (1981). Tornadoes and Downbursts in the Context of Generalized Planetary Scales. Journal of the Atmospheric Sciences, pp. 38 (8): 1511–34. Bibcode:1981JAtS…38.1511F. doi:10.1175/1520-0469(1981)038<1511:TADITC>2.0.
Glickman, T. S. (2000). Glossary of Meteorology (2nd ed.). Boston: American Meteorological Society. ISBN 978-1-878220-34-9.
Marshall, C. ((11 Jan 2016)). The National Mesonet Program. 22nd Conference on Applied Climatology. New Orleans: American Meteorological Society.
Muller, C., Chapman, L., Grimmond, C. S., Young, D. T., & Cai, X. (2013). Sensors and the City: A Review of Urban Meteorological Networks. Int. J. Climatol, pp. 33 (7): 1585–600. Bibcode:2013IJCli..33.1585M. doi:10.1002/joc.3678.
Pietrycha, A., & Rasmussen, E. N. (2004). Finescale Surface Observations of the Dryline: A Mobile Mesonet Perspective. Weather and Forecasting, pp. 19(12): 1075–88. Bibcode:2004WtFor..19.1075P. doi:10.1175/819.1.
Ray, P. e. (1986). Mesoscale Meteorology and Forecasting. Boston: American Meteorological Society. ISBN 978-0933876668.
Roulstone, I. &. (2013). Invisible in the Storm: The Role of Mathematics in Understanding Weather. Princeton: Princeton University Press.
Service, N. W. (2020, September 8). “Mesonet”. National Weather Service Glossary. Washington, DC.
Tethered Pictures. (2020, September 8). Retrieved from www.youtube.com: https://www.youtube.com/watch?v=AY3kHXRGPIQ
Wikipedia. (2020, September 8). Mesonet. Retrieved from en.wikipedia.org/wiki/Mesonet: en.wikipedia.org/wiki/Mesonet
[1] ASOS = Automated Surface Weather System
[2] AWOS= Automated Weather Observing System
[3] GIGO = refers to computer data garbage in, garbage out
[4] https://s.campbellsci.com/documents/us/product-brochures/b_hmp60.pdf
[5] A useful source is Roulstone, I. & Norury, J. (2013) Invisible in the Storm: The Role of Mathematics in Understanding Weather. Princeton University Press
