7 Failure of Climate Change [Nichols]
“The whole aim of practical politics is to keep the populace alarmed – and hence clamorous to be led to safety – by menacing it with an endless series of hobgoblins[1], all of them imaginary.”
– L. Mencken(Wrightstone G. , 2017)
Student Learning Objectives
Man-made / Influenced Catastrophic climate change (CC) and global warming (GW) are contentious issues hyped in the news and parroted with almost a religious following. It is time to at least understand the basic scientific elements that make up the climate change claims and real natural phenomena and driving forces.
It some cases, we need to push back against the outrageous and irresponsible. Our SLO is
- To understand the CC / GW processes,
- To separate facts from fiction regarding key natural phenomena: CO2 emissions, warming, temperature rise, tornadoes, hurricanes, forest fires, greenhouse gases (GHG),
- To develop facts that we can use to make up our own minds about CC / GW and its correlation to man-made behavior – especial in the last 50 years.
Introduction
Amy Coney Barrett declined to say that climate change is real, calling it instead a “a very contentious matter of public debate, especially one that is politically controversial.” during the third day of her Supreme Court confirmation hearings. (Boyle, 2020)[3] The judge made the comment on Wednesday as she was questioned by California Senator Kamala Harris, the Democratic vice-presidential nominee, (now VP) and a member of the Senate Judiciary Committee. The Supreme court nominee doubled down on comments she made on Tuesday, where she said that she has no “firm views” on climate change because she is “not a scientist”. [4]
(Boyle, 2020)
According to the UK Independent (Bolton, 2016), “Some 97 percent or more of climate scientists agree that climate-warming trends over the past century are being driven by human activities, largely the burning fossil fuels.” Maybe.
The purpose of this chapter is to develop a point – counterpoint discussion of fundamental concepts underlying climate change / global warming (GW). If we accept climate change as a disruptive technology or clear global megatrend, it behooves us to at least know the facts.
The Open Mind
Let’s take a step back for a moment and recognize four key concepts: 1) science is not accomplished by consensus – just the opposite; scientists constantly challenge the status quo to improve understanding of our world; 2) since 1785, scientists have used a very organized methodology to continually test the validity / repeatability of the status quo by the Scientific Method. It is based on fact and quantifiable observations, not on political motivation, or money (university or private funding) or hyped up news; 3) humans do not control / influence everything in their world – it is arrogant to think so; and 4) data based on limited or biased scope yields limited / incorrect / spurious / or potentially fraudulent results. Policy decisions made on such reduced data / observations are bound to be incorrect.
This chapter is not meant for those who have made up their minds and will never challenge themselves or change – irrespective of political organization. It is meant for those who are uncomfortable with the information that we are barraged with each day and at are least open to discussion so that they can make up their own minds. The author will concentrate heavily on two important and diametrically opposing references with widespread appeal. Pierre Coutu wrote Global Megatrends and Aviation: The Path to Future-Wise Organizations. (Coutu, 2019) He devotes a full 77 pages to the subject of climate change. His book is the status quo. The second reference is by Gregory Wrightstone entitled Inconvenient Facts: The science that Al Gore doesn’t want you to know. (Wrightstone G. , 2017) It is packed with facts and counterpoints, 2000 years of reference temperature data, and exquisitely sourced for each observation. Science, unlike religion or politics, is not a belief system. Science is based on a disciplined method of inquiry, by which a scientist applies pre-existing theory to observation and measurement, so as to develop or reject a theory, so as to unravel as clearly and as certainly as possible the distinction between “that which is and that which is not.” (Wrightstone G. , 2017)
Scientific Method
The scientific method is an empirical method of acquiring knowledge that has characterized the development of science since at least the 17th century.[5] It involves careful observation, applying rigorous skepticism about what is observed, given that cognitive assumptions can distort how one interprets the observation. It involves formulating hypotheses, via induction, based on such observations; experimental and measurement-based testing of deductions drawn from the hypotheses; and refinement (or elimination) of the hypotheses based on the experimental findings. These are principles of the scientific method, as distinguished from a definitive series of steps applicable to all scientific enterprises.[6] (Wikipedia, Scientific Method, 2020)
Although procedures vary from one field of inquiry to another, they are frequently the same from one to another. The process of the scientific method involves making conjectures (hypotheses), deriving predictions from them as logical consequences, and then carrying out experiments or empirical observations based on those predictions. A hypothesis is a conjecture, based on knowledge obtained while seeking answers to the question. The hypothesis might be very specific, or it might be broad. Scientists then test hypotheses by conducting experiments or studies. A scientific hypothesis must be falsifiable, implying that it is possible to identify a possible outcome of an experiment or observation that conflicts with predictions deduced from the hypothesis; otherwise, the hypothesis cannot be meaningfully tested. (Wikipedia, Scientific Method, 2020)
The purpose of an experiment is to determine whether observations agree with or conflict with the predictions derived from a hypothesis. Experiments can take place anywhere. There are difficulties in a formulaic statement of method, however. Though the scientific method is often presented as a fixed sequence of steps, it represents rather a set of general principles.
Common steps /elements of the scientific method are: Question, Hypothesis, Prediction, Experiment, and Analysis.
There are additional components to the scientific method even when all iterations of the steps above have been completed.
Replication
If an experiment cannot be repeated to produce the same results, this implies that the original results might have been in error. As a result, it is common for a single experiment to be performed multiple times, especially when there are uncontrolled variables or other indications of experimental error. For significant or surprising results, other scientists may also attempt to replicate the results for themselves, especially if those results would be important to their own work. Replication has become a contentious issue in social and biomedical science where treatments are administered to groups of individuals. (Wikipedia, Scientific Method, 2020)
External review
The process of peer review involves evaluation of the experiment by experts, who typically give their opinions anonymously. Some journals request that the experimenter provide lists of possible peer reviewers, especially if the field is highly specialized. Peer-review does not certify the correctness of the results, only that, in the opinion of the reviewer, the experiments themselves were sound (based on the description supplied by the experimenter). If the work passes peer review, which occasionally may require new experiments requested by the reviewers, it will be published in a peer-reviewed scientific journal. The specific journal that publishes the results indicates the perceived quality of the work. (Wikipedia, Scientific Method, 2020)
Scientific Inquiry
Scientific inquiry generally aims to obtain knowledge in the form of testable explanations that scientists can use to predict the results of future experiments. This allows scientists to gain a better understanding of the topic under study, and later to use that understanding to intervene in its causal mechanisms (such as to cure disease). The better an explanation is at making predictions, the more useful it frequently can be, and the more likely it will continue to explain a body of evidence better than its alternatives. The most successful explanations – those which explain and make accurate predictions in a wide range of circumstances – are often called scientific theories. (Wikipedia, Scientific Method, 2020)
Most experimental results do not produce large changes in human understanding. Improvements in theoretical scientific understanding typically result from a gradual process of development over time, sometimes across different domains of science. Scientific models vary in the extent to which they have been experimentally tested and for how long, and in their acceptance in the scientific community. In general, explanations become accepted over time as evidence accumulates on a given topic, and the explanation in question proves more powerful than its alternatives at explaining the evidence. Often subsequent researchers re-formulate the explanations over time, or combined explanations to produce new explanations.
Properties of scientific inquiry
Scientific knowledge is closely tied to empirical findings and can remain subject to falsification if new experimental observations are incompatible with what is found. No theory can ever be considered final since new problematic evidence might be discovered. If such evidence is found, a new theory may be proposed, or (more commonly) it is found that modifications to the previous theory are sufficient to explain the new evidence. The strength of a theory can be argued [by whom?] to relate to how long it has persisted without major alteration to its core principles. (Wikipedia, Scientific Method, 2020)
Beliefs and biases
Scientific methodology often directs that hypotheses be tested in controlled conditions wherever possible.
The practice of experimental control and reproducibility can have the effect of diminishing the potentially harmful effects of circumstance, and to a degree, personal bias. For example, pre-existing beliefs can alter the interpretation of results, as in confirmation bias; this is a heuristic that leads a person with a particular belief to see things as reinforcing their belief, even if another observer might disagree (in other words, people tend to observe what they expect to observe). (Wikipedia, Scientific Method, 2020)
This is a good place to Segway into the 97% claim.
97% Consensus can’t be spelled without “con”
We have heard the drumbeat that 97% of scientists agree on human-driven climate change. (Bolton, 2016) (Coutu, 2019) We have also heard that those that don’t buy into the climate -apocalypse mantra are Luddite science deniers. The author has been questioned “do I believe in climate change? His answer: “of course, it has been happening for hundreds of millions of years.” The real question relates to the human-driven actions.
Scientists do agree on two quantifiable truths:
- Carbon dioxide concentration has been increasing in recent years
- Temperatures, as measured by thermometers and satellites, have been generally increasing over the last 150 years.
What is impossible to quantify is the actual percentage of warming that is attributable to increased anthropogenic (human- caused) CO2. There is no scientific evidence or method that can determine how much warming we’ve had since 1900 was directly caused by us. (Wrightstone G. , 2017) We know that temperature has varied greatly over the millennia. (Coutu, 2019) We also know that for virtually all of time, global warming and cooling were driven entirely by natural forces, which did not cease to operate at the beginning of the Industrial Revolution. (Wrightstone G. , 2017)
The claim that most modern warming is attributable to human activities is scientifically insupportable. So what is the basis of the 97% conjecture?
Cook’s chaos
The primary paper that is often cited as the ultimate source of the 97% consensus “con” was written by John Cook and his merry band of climate extremists. He maintains a website where the paper has been downloaded more than 600,000 times. Cooks’ volunteer team [7] reviewed abstracts from 11,944 peer-reviewed papers related to clior global warming, published over 21 years 1991 -2011 to assess the extent to which they supported the “consensus view” on climate change. (Cook, 2013) Per Cooks paper:
“ We analysed a large sample of the scientific literature on global CC [climate change], published over a 21-year period, in order to determine the level of scientific consensus that human activity is very likely causing most of the current GW (anthropogenic global warming), or AGW)….” (Cook, 2013)
The paper concluded,
“Among the abstracts that expressed a position on AGW, 97.1% endorsed the scientific consensus… Among the papers expressing a position on AGW, an overwhelming percentage (97.2% based on sel-ratings, 97.1 % basted pon abstract ratings) endorses the scientific consensus on AGW.” (Cook, 2013)
Cook’s paper asserted falsely that 97% of the papers the reviewers examined had explicitly endorsed the opinion that humans are causing the majority of the warming on AGW! (Wrightstone G. , 2017)
When one looks closely at the data, one finds that 7,930 of the papers took no position at all on the subject and were arbitrarily excluded from the count on this ground. Adding these back into the total papers reviewed in the 97% count , the actual claim falls to 32.6%! But a further look at the data shows that three categories of endorsement. (Table 7.1) Only the first category amounts to explicit statement that humans are the primary cause of recent warming. The 2nd and 3rd categories would include most of sceptics of AGW. (Wrightstone G. , 2017)
Table 7.1 Expanding the “consensus” broadly
| Level of Endorsement | Description |
| (1)Explicit endorsement with quantification | Explicitly states that humans are the primary cause of recent global warming |
| (2) Explicit endorsement without quantification | Explicitly states that humans are causing global warming or refers to AGW /CC as a known fact |
| (3) Implicit endorsement | Implies humans are causing AGW; e.g. research ASSUMES greenhouse gas emissions cause warming without explicitly stating that humans are the cause |
Source: (Cook, 2013)
Here is a new word: Agnotology.[8] David Legates and his co authors used this word to review / describe the Cook paper as an attempt to falsely promote the notion of broad scientific consensus surrounding the subject of a looming, man-made, climate apocalypse. (Legates, 2015) Legates reviewed their actual papers used by Cook and found only 0.3% of the 11,944 abstracts and 1.6% of the smaller sample that expressed those papers expressing no opinion endorsed man-made global warming as they defined it. (Legates, 2015)
97% [9] Consensus = con.
Global Warming – Status Quo ( as applied to the aviation industry)
According to Contu, “at the heart of global warming are greenhouse gases (GHG) which are generated by human activity.” He also states that “climate change is both a reality and a potential threat that “experts” believe could lead to global catastrophe if not addressed diligently and with vigor.” “Lastly, the potential catastrophic consequences of climate change and global warming loom large in the public discourse, from headlines in the news and social media to boardrooms and living rooms, yet current measures to mitigate the phenomenon and begin reversing its destructive effects seem eerily wanting.” (Coutu, 2019) [10]
Contu leads us down a path of 77 pages increasing expenditures, extreme policy making, fear and complete hype applied to emission controls in the aviation industry. Try these on for size: “ The global climate change is one of the greatest, if not THE greatest human-made threats to its survival that humanity has ever faced.”[11] “Humanity may not survive..” “There is no doubt that the Environmental / Climate Change megatrend will have major impacts on the aviation industry over the next 15-20 years and beyond. “ (Coutu, 2019) Finally, his core premise is “ Greenhouse gases (GHG) generated mostly by human activity are at the heart of climate change, (aka global warming). Half the fossil-fuel CO2 emissions produced by human activity in the last 300 years have occurred since the late 1980’s and the 2014 global fossil-fuel carbon emission estimate was an all-time record.” (Coutu, 2019) Again we have a good segway into a discussion about GHG.
Greenhouse Gases – our security blanket
The greenhouse effect,(GE) the important mechanism by which the earth remains, comfortably warm, and livable, is also the pretext for the advancement of the doomsday predictions about carbon dioxide-driven global warming. It is central to the CC debate. It is central to the (Coutu, 2019) presentation. Lets see if we can boil down the GE to basics.
While 30% of the Sun’s radiation is reflected by clouds, most of it passes through the earth’s atmosphere and strikes the surface. There it is absorbed and its energy is emitted in the near-infrared spectrum. [12] Some of the re-emitted energy is absorbed by greenhouse – gas molecules. As they absorb radiation, they in turn emit energy in the form of heat. This is the greenhouse effect. (Wrightstone G. , 2017)
Greenhouse gases and the warming they cause keep the Earth at a comfortable average temperature of 15o
Celsius (59o Fahrenheit). Without them, the Earth would be unlivable – 18o C (-0.4o F). (Wrightstone G. , 2017)[13] Extremes of GE warming are nearby planets of Venus & Mars. See Table 7.2 The Goldilocks effect. (Wrightstone G. , 2017)
Table 7.2 The Goldilocks effect.
| Planet | Atmospheric composition | Surface Temperature ( no greenhouse effect) | Relative size of greenhouse effect | Mean surface temperature |
| Venus | 96% CO2 | –40 oC (-40 o F) | 100 | 462 oC (863 o F) |
| Earth | 0.04% CO2
Ideal for life |
-18 oC (-0.4 o F) | 1 | 15 oC (59 o F) |
| Mars | 95% CO2 | -56 oC (–69 o F) | 0.1 | -55 oC (-67 o F) |
Source: (Wrightstone G. , 2017)
The most significant greenhouse gas (driver) of all is water vapor. CC enthusiasts (Coutu, 2019) do not mention it at all. National Geographic and EPA list the greenhouse gases “include carbon dioxide (CO2) , methane, nitrous oxide (N2O), fluorinated gases, and ozone.” (Wrightstone G. , 2017) A breakdown of these gases excluding water vapor is methane 19%, carbon dioxide 63% and other 18%. But including water vapor the breakdown is water vapor 90%, carbon dioxide 6%, methane 2% and other 2%. So water vapor contributes the lions share of the greenhouse effect. (Wrightstone G. , 2017) Both (Coutu, 2019) and (Wrightstone G. , 2017) agree that water vapor is a primary driver. There is serious disagreement on how much warming will occur due to increases of GH gases, or how much of that warming is or will be man-made. (Wrightstone G. , 2017) Warming allows the atmosphere to increase the amount of water vapor it can carry, which can then add to the GH effect (water-vapor feedback), but neither reference agrees on magnitude of this multiplier effect on global warming. Overblown estimates of water-vapor feedback will lead to overestimating the future warming in the climate models. This is why they fail. (Wrightstone G. , 2017)
Fact 1
Carbon dioxide is NOT the primary greenhouse gas.
Analysis
It is no more sensible to attempt to regulate weather by declaring CO2 to be a pollutant than it is to try to regulate water vapor or declare it to be a pollutant. Water vapor is the main contributor to the GH effect. (Wrightstone G. , 2017) The role of water vapor in climate models and predictions on it is an inexact science. The amount of water in the atmosphere varies markedly from place to place and from day to day. Absolute humidity can range from near zero in deserts and Antarctica – the Earth’s driest continent to about 4% in the steamy tropics. Small changes in water vapor can so affect the GH effect as would a doubling of the present CO2 in the atmosphere. (Wrightstone G. , 2017) Downplaying or disregarding water vapor, or assigning too large a magnitude to feedbacks such as water vapor feedback will amplify the direct warming from CO2, and overemphasize man’s contribution to the GH effect. (Wrightstone G. , 2017)
Fact 2
The warming effect of CO2 declines as its concentration increases.
The warming effect of each molecule of CO2 decreases logarithmically as its concentration increase. (Wrightstone G. , 2017) Think about Fact 2 for a moment. Why haven’t we experienced runaway GH warming when the concentration of CO2 was approaching 20X that of today? If you think about this fact, it undermines the theory of future catasphrophic climate change. [prediction per (Coutu, 2019)] Figure 7.2 shows that the principle of diminishing returns applies, i.e. as CO2 concentrations increase, the global warming effect diminishes. (Hoskins, 2014)
Figure 7.1 The Greenhouse Effect
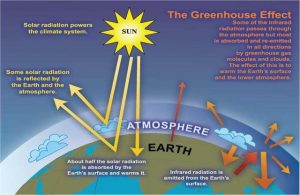
Source: (Deshmukh, 2020)
Figure 7.2 The diminishing influence of increasing Carbon Dioxide on temperature
Source: (JoNova, 2010)
From Facts 1 & 2, we note that CO2 is a GH gas and that increasing CO2 concentrations will increase global temperature to a small degree. However, is this slight warming effect overwhelmed by natural climate drivers that have been active for hundreds of millions of years? (Wrightstone G. , 2017) And is it worth $100 trillion dollars or more to reduce a small increase of CO2?
Combined Fact(s) 3
CO2 is not the demon causing catastrophic global warming; it is in fact an essential plant food. It means more plant growth, more food for people worldwide, and soil with more moisture.
According to the NIPCC, higher CO2 concentrations has the following benefits:
- Nearly all plants increase photosynthesis in response to increasing CO2 (CO2 fertilization)[14]
- More CO2 makes plants grow faster, with less stress and less water.
- Forests grow faster in response to increasing CO2
- More CO2 stimulates growth of beneficial bacteria in both soil and water.
- CO2 fertilization, leads to more plant growth, means less erosion of topsoil.
- More CO2 means bigger crop yields, and bigger flowers.
- More CO2 fosters glomalin, a beneficial protein created by root fungi.
- More CO2 means less water loss, less irrigation, and more soil moisture.
- More CO2 helps plants to create natural repellents to fight insect predators. (Carter RM, 2014)(Wrightstone G. , 2017)
Figure 7.3 improves on the above benefits description.
Figure 7.3 Shows 45 crops with crop yield growth and cash benefit with 300 ppm more CO2 (based on 3,586 experiments on 549 plant species)
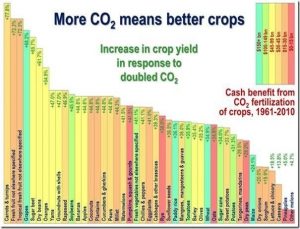
Sources: (Monckton, 2019) (Idso, 2014)
Fact 4
400 PPM of CO2 is not a tipping point, not science and disinformation (propaganda)
“We are on the precipice of climate system tipping points beyond which there is no redemption.”
–James Hansen, Former head of NASA’s Goddard Institute for Space Studies. (Wrightstone G. , 2017)
“This March [2014], global levels of CO2 passed 400 PPM..Already we are seeing the deadly effects of climate change in the form of rising seas, monster storms, wildfires, and extreme weather of all kinds. Passing 400 PP is an ominous sign of what might come next.” [15] (400.350.org, 2014)
The concentration of CO2 in the air has increased from about 280 PPM by volume in the mid-18th century, to a little above 400 PPM today. If we view this recent data through a narrow time-frame of a few decades
or centuries, this increase in 120 PPM in CO2 appears significant. But it is not on the timeline of Earth’s history. (Wrightstone G. , 2017) (Coutu, 2019)
Figure 7.4 Carbon Dioxide – 600 Million Years of Data
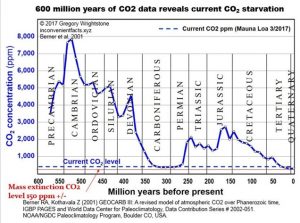
Source: (Berner RA, 2001)
The notion of a “tipping point” beyond which Earth cannot recover, without a drastic reduction in CO2 emissions, is not science. It is disinformation by climate extremists and contradicts Earth’s history (reality).
Figure 7.4 shows that CO2 levels were many multiples of 400 PPM during virtually all of Earth’s history.
400 PPM represents an arbitrary number that was selected because it could likely be reached by 2014. (Wrightstone G. , 2017) It was an easy way to stoke fires of anti-CO2 legislation.
Fact 5
Our current geological period (Quaternary) has the LOWEST average CO2 levels in the history of the Earth[16]
Contrary to the disinformation from the media that today’s CO2 concentration is unprecedented, our current geologic period, has seen the lowest average levels of carbon dioxide in the Earth’s long history. The average CO2 for the past 800,000 years was 230 PPM. (Lüthi, et al., 2008)
The average CO2 concentration in the preceding 600 million years (Figure 7.4) was more than 2600 PPM, nearly 7X our current amount and 2.5 X the worst case predicted by the IPCC for 2100. Our current geological period (Quaternary) has the LOWEST average CO2 concentration in the history of the Earth. (Berner RA, 2001)
Ed Ring wrote a scathing letter which is quoted in part:
“What historians will definitely wonder about in future centuries is how deeply flawed logic, obscured by shrewd and unrelenting propaganda, actually enabled a coalition of powerful special interests to convince nearly everyone in the world that carbon dioxide from human industry was a dangerous, planet-destroying toxin.”
“It will be remembered as the greatest mass delusion in the history of the world; that carbon dioxide, the life of plants, was considered for a time to be a deadly poison.” [17] (Ring, 2015)
The carbon dioxide molecule, which has been more recently defined by radical environmental groups as a pollutant or poison, is absolutely essential to sustain plant and animal life here on Earth. To corrupt the English language in this way is simply a sleazy tactic to demonize this life-giving gaseous molecule.”
Temperature
Climate change enthusiasts tell us that the warming of recent decades is unusual and unprecedented. (Coutu, 2019) Climate -science research has focused on recent record – 250 years for thermometers and 50 years for satellites. This short time span skews interpretation of data. (Wrightstone G. , 2017)[18] To put the data into proper context, we need to take a long-term geologic perspective – thousands and millions of years.
Hockey- Stick Graph and prediction of Unprecedented Global Warming
Until 1998 the consensus view was that over the last several thousand years temperatures had risen and fallen as shown in noted climatologist Hubert Lamb’s graph, Figure 7.5. (Houghton J. J., 1990)
Figure 7.5 Hubert Lamb’s temperature graph of the past 1,100 years
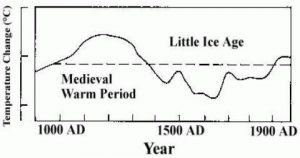
Source: (Houghton J. J., 1990)
Study this figure. The figure shows warming beginning in the late 17th century as earth began to extract itself from the Little Ice Age (1250-1850). It was followed by recent temperatures significantly less than those experienced in the Medieval warming period (950-1250). Previous “consensus” established several warm periods had occurred over the last 10,000 years[19] and all were warmer than today, even though CO2 concentration was only 70% of today’s. Note that higher temperatures at lower CO2 concentrations does not support the notion that connects rising CO2 to a harmful temperature increase to justify draconian measures to reduce carbon footprint. (Coutu, 2019) v (Wrightstone G. , 2017) Another observation by IPCC is that the current warming trend began more than 200 years before any significant man-made contribution to the GHG in the atmosphere. (Houghton J. e., 2001) See Figure 7.6.
Michael Mann
Mann and his team purported to reconstruct 1,000 years of the Earth’s temperature. They stated “ temperatures in the latter half of the 20th century were unprecedented and that even the warmer intervals in the reconstruction pale in comparison with the mid-to-late 20th- century temperatures.” This is the famous “hockey -stick graph” which shows the 900-year shaft of slowly declining temperature followed by by a short blade of rapidly increasing temperature. (Mann ME, Global-Scale temperature patterns and climate forcing over the past six centuries , 1998) (Mann ME, Northern Hemisphere Temperatures during the post millennium: Inferences, Uncertainties, and Limitations, 1999) (Houghton J. e., 2001)
The hockey-stick graph became the linchpin as “proof” of the causal link between GHG and dangerous warming. (Houghton J. e., 2001)
Figure 7.6 Mann-made Hockey Stick
Source: (Mann ME, Global-Scale temperature patterns and climate forcing over the past six centuries , 1998) (Houghton J. e., 2001)
If Mann’s depiction of temperature is correct, then his work is fundamental basis for recent warming being man-made. However, both sides of the CC argument have criticized the Mann graph. Two fundamental errors are data sourcing and data handling. Mann based his work on temperature proxies on a relatively small dataset of tree-ring data from California bristlecone pines, and a very small sample from cedars on the Gaspe Peninsula. The IPCC (his biggest fan) challenged the sourcing as a poor choice because the width of annual tree-ring will grow thicker only when the weather is warmer, but also wetter, or when more CO2 in the air fertilizes the tree and boosts growth. (Wrightstone G. , 2017) Mann ignored a significant number of trees in the sample area that did not show results that he desired. (Mann ME, Global-Scale temperature patterns and climate forcing over the past six centuries , 1998)
Two Canadian researchers McIntyre and McKitrick (MM) found that ANY data they plugged into Mann’s formula produced the hockey-stick effect. They concluded that the temperature reconstruction was fatally flawed, poor handling of data and incorrect calculation. (Mann, 1998) (Jones, 2004) (Rutherford, 2004) To be fair, the MM challenge was also challenged by climate change enthusiasts as false procedures. (McKitrick, 2005) (Anonymous, 2004) [20]
Temperature Measurement
Of the three ways to measure atmospheric temperature: land and ocean surface thermometers (since 1659); weather balloons (mid-1950’s) and satellites (since 1979) , satellites is the most reliable but with a short history. So what does this tell us? For the last 50 years , temperature measurements are accurate and this supports the Mann proposition of rapidly accelerating temperature data in the most recent five decades. If Mann’s modelling of global temperatures were correct, then 900 years of cooling would be followed by a sharp temperature increase in the 20th century. This would be strong evidence linking man’s activities to modern GW. The counter evidence to the Mann argument would be data showing that modern warming began before CO2 began to rise sharply. (Wrightstone G. , 2017) (Coutu, 2019) does not address this important issue. If the latter can be demonstrated , it would suggest that natural forces were the primary driver of warming prior to 1900 and likely remain in effect today.
HadCET
The Central England temperature record (HadCET) contains the longest continuous measured regional temperature dataset in the world. It goes back more than 350 years. It began in 1659, during the coldest temperatures in the last 4,500 years. (Parker DE, 1992)(Boden TA, 2016)(Wrightstone G. , 2017)
Fact 6
Modern Warming began long before SUVs, Model T’s or coal-fired plants, or modern planes
Figure 7.7 Central England Temperatures (CET) from 1659-2017 and CO2 levels
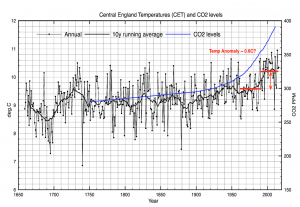
Source: (Best, 2017)[21]
Each period on Figure 7.7 has a name and associated effects on humanity. The key takeaway is that warming began more than 200 years before any significant contribution of man-made CO2 to the atmosphere. This contradicts the Mann hockey-stick depiction of steady cooling during this time. The natural forces driving temperature increases during the 18th and 19th centuries did not abruptly cease to act during the 20th century. (Wrightstone G. , 2017) (Boden TA, 2016) sees the same CET data but measures the CO2 in billions of metric tons emissions globally on the right horizontal axis. This is more dramatic in that CO2 emissions (bmt) is practically zero in 1759 -1859; is still less than 2 bmt in 1959 and then rises to 11 bmt in 2009. (Boden TA, 2016)
Melting Glaciers and Rising Sea Levels
(Wrightstone G. , 2017) spends considerable space on the argument that melting glaciers and rising sea levels confirm warming predated increases in CO2. The most significant Figure is his I-30 showing 10,000 years of warmth. Look at Figure 7.8.
Figure 7.8 10,000 years of warming
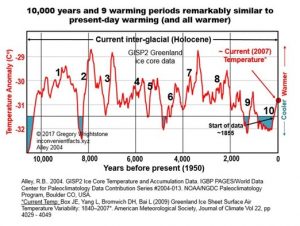
Sources: (Alley, 2004)
Figure 7.8 is a substantial dataset that shows that modern warming is neither unusual or unprecedented. The data show that for more than 6,100 years (60%) of the current interglacial warm period, the temperature was warmer than it is today. Of the 9 significant periods of warming, since the last ice age, 5 had higher rates of temperature increase and 7 had larger total increases in temperature. This should lead to fact 7.
Fact 7
The current warming trend is a natural and predictable result of driving forces since the last ice age (aka The Little Ice Age (1250-1850)
Forest Fires
Noted climatologist and egg layer, VP nominee Kamala Harris , in her attacks on Supreme Court nominee, Judge Amy Coney Barrett (ACB) stated unequivocally that forest fires are accelerating in frequency and size, owing to man-made climate change. The National Interagency Fire Center (NIFC) provides extensive information on forest fires in the United States. (NIFC, 2017) See Figure 7.9.
Figure 7.9 More CO2 but fewer forest fires
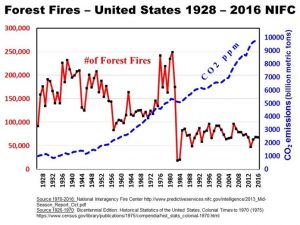
Source: (NIFC, 2017)
Fact 8
Forest fires in the northern hemisphere are decreasing
A supporting study by the Canadian Forest Service (CFS) compared temperatures, CO2 concentrations and forest fire frequency over 150 years in North America. (Flannigan, Bergeron, Engelmark, & Wotton, 1998)
Their conclusions:
“Despite increasing temperatures since the end of the LIA[22], wildfire frequency has decreased as shown in many field studies from North America and Europe. We believe that GW since 1850 may have triggered decreases in fire frequency.”[23]
Tornadoes
Tornadoes are scary because they kill and injure US citizens more than any other storm. The unique geography of the US makes it tornado-prone. The Rocky Mountains and the Gulf of New Mexico provide the key ingredients for formation of severe thunderstorms that spawn tornadoes: warm, moist air close to the ground; cool, dry air aloft; and horizontal winds that travel faster aloft than near the surface. (Wrightstone G. , 2017) NOAA keeps the records on tornadoes. [24] (NOAA, NOAA NCEI Historical Records and Trends, 2017) NOAA recommends only using the strongest tornadoes as a measure of pre-radar numbers. Doppler radar detection has facilitated better identification and reporting of tornados after WWII. Table 7.3 shows the tornados rank. NOAA recommends using 3+ on the scale for reporting. (NOAA, NOAA NCEI Historical Records and Trends, 2017)
Table 7.3 The Fujita tornado scale
| F | 0 | 1 | 2 | 3 | 4 | 5 |
| Fastest ¼ mile (mph) | 40-72 | 73-112 | 113-157 | 158-207 | 208-260 | 261-318 |
| Fastest 3-second gust (mph) | 45-78 | 79-117 | 118-161 | 162-209 | 210-261 | 262-318 |
Source: (NOAA, NOAA NCEI Historical Records and Trends, 2017)
Combined Facts 9
- The number of tornadoes is decreasing with 2016 showing the lowest on record (NOAA, NOAA NCEI Historical Records and Trends, 2017)
- CO2 global emissions has increased at the same time severe tornadoes ( F3+) has decreased (Boden TA, 2016)[25]
- US tornado deaths per million population continues to fall through 2000 (NOAA, us-annual-tornado-death-tolls-1875-present/, 2009)
- Science and data show no correlation between tornadoes and rising temperatures over the last 50 years. (Wrightstone G. , 2017)
Figures 7.9-7.11 support the above FACTS 9. Figure 7.10 shows the decline of severe tornadoes (F3+) over last 50 years. Figure 7.11 shows that 2016 was a banner year. Figure 7.12 shows that tornado deaths per million population is also decreasing than 50 years ago.
Figure 7.10 Severe tornadoes (F+4) are less frequent
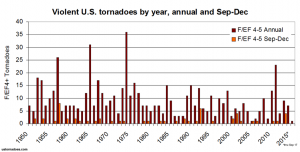
Source: (ustornadoes.com, 2015)
(Boden TA, 2016) confirms the growth of CO2 global emissions (bmt) [26] plotted against the same Figure 7.10 as increasing from 1954 -2015 to just under 10 bmt.
Figure 7.11 Lowest number of tornadoes in 2016
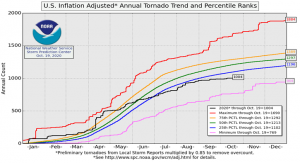
Source: (NOAA, Storm Prediction Center, 2020)
Note that 2106 had 901 tornadoes. 2020 logged 1004.
Figure 7.12 US tornado deaths per million population
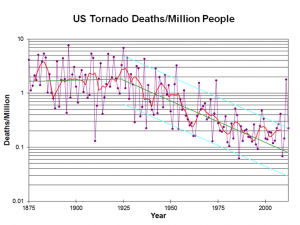
Source: (NOAA, us-annual-tornado-death-tolls-1875-present/, 2009)
Hurricanes
Noted climatologist and egg layer, VP nominee Kamala Harris (now elected VP), in her attacks on Supreme Court nominee, Judge Amy Coney Barrett (ACB) also stated unequivocally that hurricanes are accelerating in frequency and size, owing to man-made climate change. The conventional wisdom behind this thinking is that GW raises ocean temperatures, fueling tropical cyclones and hurricanes. Actually, this sounds reasonable. However, we saw in our treatment of deadly tornadoes that the CW was wrong, and that the evidence / data suggested that frequency of deadly tornadoes was decreasing over last 50 years. (NOAA, NOAA NCEI Historical Records and Trends, 2017)
Promoters of the notion of GW causation of more severe hurricanes includes the National Climate Assessment (NCA) of 2014. (Kossin JP, 2007) There review of power dissipation index vs time , using satellite-based re-analyses does show an solid increasing trend. Dr Ryan Maue challenged that data for insufficient range analysis.[27] (Maue, 2016) Using the entire dataset (not 15% like the NCA2014) and including land-falling hurricanes his conclusions were quite a bit different. (Maue R. , 2017) See Figure 7.13.
Figure 7.13 Global tropical storm and hurricane frequency is falling
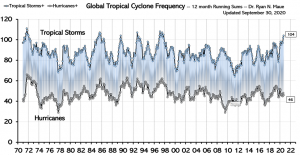
Source: (Maue R. , 2017)
Dr Maue concluded that from 1970-2018 there is a downward trend of hurricane and tropical storm frequency. The author reviews the same data and sees an even or slight downward trend but not increasing.
Fact 10
There has been no increase in frequency of hurricanes in recent data
But what about the warming argument? Dr Landsea, a meteorologist at the National Hurricane Center (NHC) has quantified what an increase in intensity of major hurricanes, driven by GW, might mean. (Landsea, 2011) His work indicates that the warming over the last several decades translates into an increase of intensity of 1%. For Katrina (Cat 5), the wind speed would increase 2 mph. He wrote:
“The 1-2 mph change currently in the peak winds of strong hurricanes due to man-made GW is so tiny that it is not measurable by our aircrafts or satellites technologies available today, which is only accurate to about 10 mph for major hurricanes.” (Landsea, 2011)
Which brings to Fact 11.
Fact 11
There is no significant increase in hurricane intensity due to warming
(Landsea, 2011) (Wrightstone G. , 2017)
Conclusions
This chapter has taken the idea that because of man-made GW / CC, our society is headed for climate Hell from which we cannot return. But Earth, its ecosystems, and we humans are actually thriving because of the increasing CO2 and rising temperatures, not in spite of it! (Wrightstone G. , 2017)
Yes there is a GH effect. Yes there is some warming. Yes, some of it might be man-made. We can expect more. They are all demonstrable. (Wrightstone G. , 2020)
But no, past and future anthropogenic warming does NOT mean that catastrophe will follow, or that measures to prevent GW are scientifically and economically justified. (Wrightstone G. , 2017) [ Here we drastically differ from the thrust / organizational and investment measures suggested by (Coutu, 2019).]
As Wrightstone suggests, “the first and most important conclusion is that the correct policy to address the non-problem of man-made global warming is to have the courage to do nothing.” (Wrightstone G. , 2017)
Questions
1) There are other claims about GW affects: ocean acidity, polar bears, melting ice caps, droughts, crops, and sea-level rise to name just a few. Choose one topic to research and see if you agree with the conventional wisdom and “consensus” or can you develop / find data / synthesize data using the scientific method that at least puts CW into question on your choice as to voracity. Make up your own mind. [28]
References
400.350.org. (2014). GLOBAL CO2 CONCENTRATIONS JUST PASSED 400 PARTS PER MILLION. Retrieved from 400.350.org/: http://400.350.org/
Alley, R. (2004). GISP2 Ice Core Temperature and Accumulation Data. Retrieved from ftp.ncdc.noaa.gov/pub: ftp://ftp.ncdc.noaa.gov/pub/data/paleo/icecore/greenland/summit/gisp2/isotopes/gisp2_temp_accum_alley2000.txt
Anonymous. (2004, December). false-claims-by-mcintyre-and-mckitrick-regarding-the-mann-et-al-1998reconstruction/. Retrieved from www.realclimate.org/: http://www.realclimate.org/index.php/archives/2004/12/false-claims-by-mcintyre-and-mckitrick-regarding-the-mann-et-al-1998reconstruction/
Berner RA, K. Z. (2001, February 1). GEOCARB III: A REVISED MODEL OF ATMOSPHERIC CO2 OVER PHANEROZOIC TIME. American Journal of Science, pp. Vol 301: 182–204]. Retrieved from https://agbjarn.blog.is/users/fa/agbjarn/files/geocarb_iii-berner.pdf: https://agbjarn.blog.is/users/fa/agbjarn/files/geocarb_iii-berner.pdf
Best, C. (2017, January). CET-annual-CO2.png. Retrieved from clivebest.com/blog: http://clivebest.com/blog/wp-content/uploads/2017/01/CET-annual-CO2.png
Boden TA, M. G. (2016). Global CO2 emissions from Fossil-Fuel burning Cement Manufacture and gas flaring 1751- 2013. Carbon Dioxide Information Analysis Center, , Oak Ridge Nat Lab.
Boller, J. P., & George, J. (1989). They Never Said It: A Book of Fake Quotes, Misquotes, and Misleading Attributions. New York: Oxford University Press. pp. 124–126.
Bolton, D. (2016, April 13). 97% of scientists believe climate change is caused by humans, study finds. Retrieved from independent.co.uk/: https://www.independent.co.uk/news/science/global-warming-climate-change-man-made-scientific-consensus-study-a6982401.html
Boyle, L. (2020, October 15). amy-coney-barrett-climate-change-supreme-court-2020-election. Retrieved from www.independent.co.uk: https://www.independent.co.uk/environment/amy-coney-barrett-climate-change-supreme-court-2020-election-b1041390.html
Carter RM, e. a. (2014). Biological Impacts. In H. Institute, Climate change reconsidered II. Chicago: Idso CD, Idso SB.
Cook, J. N. (2013). Quantifying the consensus on anthropogenic global warming in the scientific literature. Environ Res Lett, 8(2):024024.
Coutu, P. (2019). Global Megatrends and Aviation- The Path to Future-Wise Organizations. Montreal: ASI Institute.
Deshmukh, C. (2020, October 16). Greenhouse_gas_emissions_CH4_CO2_and_N2O_from_a_newly_flooded_hydroelectric_reservoir_in_subtropical_South_Asia_The_case_of_Nam_Theun_2_Reservoir_Lao. Retrieved from www.researchgate.net/: https://www.researchgate.net/publication/278643412_Greenhouse_gas_emissions_CH4_CO2_and_N2O_from_a_newly_flooded_hydroelectric_reservoir_in_subtropical_South_Asia_The_case_of_Nam_Theun_2_Reservoir_Lao_PDR/figures?lo=1
Flannigan, M. D., Bergeron, Y., Engelmark, O., & Wotton, B. M. (1998). Future Wildfire in Circumboreal Forests in Relation to Global Warming. Retrieved from sites.ualberta.ca/~Flannigan/publications/: https://sites.ualberta.ca/~flanniga/publications/1998%20Flannigan%20et%20al.%20J%20Veg%20Sci%20-%20Future%20wildfire%20in%20circumboreal.pdf
Hoskins, E. (2014, August 10). the-diminishing-influence-of-increasing-carbon-dioxide-on-temperature/. Retrieved from https://wattsupwiththat.com: https://wattsupwiththat.com/2014/08/10/the-diminishing-influence-of-increasing-carbon-dioxide-on-temperature/
Houghton, J. e. (2001). Climate Change 2001 The Scientific Basis. Contribution of Working Group I to the Third Assessment Report on Intergovernmental Panel on Climate Change. New York: Cambridge University Press.
Houghton, J. J. (1990). Climate Change The IPCC Scientific Assessment. New York: Cambridge University Press.
Idso. (2014). The positive externalities of carbon dioxide. Retrieved from www.co2science.org: http://www.co2sciuence.org/education/reports/co2benefits/monetarybenefitsof risingCO2on globalfoodproduction.pdf
Jones, P. M. (2004). Climate Over Past Millennia. Reviews of Geophysics, 42, RG2002, doi: 10.1029/2003RG000143, 2004.
JoNova. (2010, February 2). carbon-dioxide-is-already-absorbing-almost-all-it-can. Retrieved from http://joannenova.com.au/: http://joannenova.com.au/2010/02/4-carbon-dioxide-is-already-absorbing-almost-all-it-can/
JVL. (2020, October 15). Joseph Goebbels: “On the Big Lie” . Retrieved from jewishvirtuallibrary.org: www.jewishvirtuallibrary.org
Kossin JP, K. K. (2007). Geophysical Research Letters. Retrieved from nca2014.global-change.gov: http:nca2014.global-change.gov/search/node?search_api_views_fulltext=hurricane%20pdi
Landsea, C. (2011). Hurricanes and Global Warming. Opinion Piece on NOAA website . Retrieved from www.aoml.noaa.gov: http://www.aoml.noaa.gov/hrd/landsea/gw_hurricanes
Legates, D. S. (2015). Climate consensus and ‘misinformation’: a rejoinder to ‘Agnotology, scientific consensus, and the teaching and learning of climate change. Sci Edu, 24:299-318.
Lüthi, D., Le Floch, M., Bereiter, B., Blunier, T., Barnola, J.-M., Siegenthaler, U., . . . Stocker, T. F. (2008). High-resolution carbon dioxide concentration record 650,000 – 800,000 years before present. Nature, pp. 453, 379-382. doi:https://doi.org/10.1038/nature06949
Mann ME, B. R. (1998). Global-Scale temperature patterns and climate forcing over the past six centuries . NATURE, Vol 392.
Mann ME, B. R. (1999). Northern Hemisphere Temperatures during the post millennium: Inferences, Uncertainties, and Limitations. Geophysical Research Letters, Vol 26, No 6, pp 759-762.
Mann, M. R. (1998). Global-scale temperature patterns and climate forcing over the past six centuries. Nature, 392, 779-787.
Maue. (2016). Atlantic Basin Power Dissipation Index from HURDAT2. Retrieved from models.weatherbell.com/tropical.php: http: //models.weatherbell.com/tropical.php
Maue, R. (2017). Global tropical Cyclone activity. Retrieved from weatherbell models: http: //models.weatherbell.com/tropical.php
McKitrick, S. M. (2005, February). Hockey sticks, principal components, and spurious significance. Retrieved from agupubs.onlinelibrary.wiley.com: https://agupubs.onlinelibrary.wiley.com/doi/full/10.1029/2004GL021750
Monckton, C. (2019, September 17). if-sir-david-king-is-scared-about-global-warming-we-neednt-worry/. Retrieved from wattsupwiththat.com: https://wattsupwiththat.com/2019/09/17/if-sir-david-king-is-scared-about-global-warming-we-neednt-worry/
Nichols, R. K., Mumm, H. C., Lonstein, W. D., Ryan, J. J., Carter, C. M., & & Hood, J. P. (2020). Counter Unmanned Aircraft Systems Technologies & Operations. Manhattan, KS: New Prairie Press #31.
Nichols, R. K., Mumm, H. C., Lonstein, W. D., Ryan, J. J., Carter, C., & and Hood, J.-P. (2019). Unmanned Aircraft Systems in the Cyber Domain, 2nd Edition. Manhattan, KS: NPP eBooks. 27. Retrieved from www.newprairiepress.org/ebooks/27
Nichols, R., Ryan, J., Mumm, H., Lonstein, W., Carter, C., & & Hood, J. (2019). Unmanned Aircraft Systems (UAS) in Cyber Domain: Protecting USA’s Advanced Air Assets, 2nd Edition. Manhattan, KS: New Prairie Press #27 .
NIFC. (2017). NIFC Total Wildland Fires and CO2 (1960-2015). Retrieved from www.nifc.gov: https://www.nifc.gov/fireinfo/fireinfo_stats_totalfires,html
NOAA. (2009, March). us-annual-tornado-death-tolls-1875-present/. Retrieved from https://inside.nssl.noaa.gov: https://inside.nssl.noaa.gov/nsslnews/2009/03/us-annual-tornado-death-tolls-1875-present/
NOAA. (2017). NOAA NCEI Historical Records and Trends. Retrieved from www.ncdc.noaa.gov: https://www.ncdc.noaa.gov/climate-information/extreme-events/us-tornado-climatology
NOAA. (2020). Storm Prediction Center. Retrieved from https://www.spc.noaa.gov/wcm/adj.html: https://www.spc.noaa.gov/wcm/adj.html
Parker DE, L. T. (1992). A new Daily Central England Temperature Series 1772-1991. Int. J. Clim., Vol 12, pp 317-342.
Randall K. Nichols, D. J. (2000). Defending Your Digital Assets against Hackers, Crackers, Spies and Thieves. New York: RSA Press.
Ring, E. (2015, January 22). opinion/letters-to-the-editor/letter-politics-disguised-as-science/. Retrieved from https://www.aspentimes.com: https://www.aspentimes.com/opinion/letters-to-the-editor/letter-politics-disguised-as-science/
Rutherford, S. M. (2004). Proxy-based Northern Hemisphere Surface Temperature Reconstructions: Sensitivity to Methodology, Predictor Network, Target Season and Target Domain. Journal of Climate, in press.
Tallentyre, S. (1906). “Helvetius: The Contradiction”. The Friends of Voltaire. London: Smith, Elder, & Co. p. 199.
ustornadoes.com. (2015, September). violent-tornadoes-by-year-2015. Retrieved from www.ustornadoes.com: https://www.ustornadoes.com/wp-content/uploads/2015/09/violent-tornadoes-by-year-2015.gif
Wikipedia. (2020, October 15). James_Watson. Retrieved from en.wikipedia.org/: https://en.wikipedia.org/wiki/James_Watson
Wikipedia. (2020, October 17). Photosynthesis. Retrieved from en.wikipedia.org: https://en.wikipedia.org/wiki/Photosynthesis
Wikipedia. (2020, October 15). Scientific Method. Retrieved from en.wikipedia.org/: https://en.wikipedia.org/wiki/Scientific_method
Wrightstone, G. (2017). Inconvenient Facts: The science that Al Gore doesn’t want you to know. New York, NY: Silver Crown Productions.
Wrightstone, G. (2020, October 17). statement-to-the-pa-environmental-resources-energy-committee. Retrieved from inconvenientfacts.xyz: https://inconvenientfacts.xyz/blog/f/statement-to-the-pa-environmental-resources-energy-committee
[1] Translate as “crises.”
[2] Special Disclaimer:
The author of this chapter is not a climatologist. His formal training in weather is limited to USCG courses taken as an Ensign in USCGA, to better his experience as a boat captain. He is an experienced engineer, scientist, advanced mathematician, author, managing editor, and qualified researcher. His experience includes five decades of advanced simulation and modeling experience for chemical engineering, business, and INFOSEC / counterterrorism processes. He is recognized as a Subject Matter Expert in cryptology and forensics by the USDOJ and an SME in counterterrorism by the DTRA. He knows how to differentiate facts from fiction and to develop complex risk assessments of key threats, vulnerabilities, impact, and countermeasures for information and intelligence systems – most recently with unmanned aircraft systems. The point is he is neither a sheep nor parrot of conventional wisdom. He knows how to think and judge for himself the issues/ information in dispute. Climate change is a contentious issue where many minds are closed to challenges of their basic beliefs. However, by definition, scientific research is a constant challenge of our beliefs in the natural processes and order. By its very nature and methodology, scientific research provides us with tools to better understand our environment free (or should be free) of political or financial pressures to divine an answer because of popularity or agenda. Recognizing that the author does not breathe in a vacuum, this chapter does not necessarily represent the opinions of my employer, my professional Board(s) associations, certifying authorities, my team, my colleagues, my oldest daughter or newest daughter-in-law, my congressmen or state senators and any individual or organization that sponsors / reads my work or hears my presentations on unrelated issues like counter unmanned aircraft systems. The information provided is based on personal reasonable research and proffered as an alternative to “conventional wisdom.”
[3] This is exactly what a SCOTUS nominee should do. Remain neutral and avoid public comment on contentious issues of public policy.
[4] This statement has been thrown around in so many media that it goes unchallenged. Saul Alinsky in his “Rules for Radicals” is credited with “if you tell a lie big enough and keep repeating it, people will eventually come to believe it.“ The actual source is Joseph Goebbels, Nazi propaganda minister. (JVL, 2020)
[5] The author is both a scientist and engineer. He was introduced to the method in 1959. In 1962, the author was awarded, as a senior in HS, a scientific internship and scholarship to Rockefeller Institute of Technology in NYC. In that august body one of the most famous scientific discoveries was made and awarded the Nobel Prize to James Dewey Watson KBE an American molecular biologist, geneticist, and zoologist. In 1953, he co-authored with Francis Crick the academic paper proposing the double helix structure of the DNA molecule. Watson, Crick and Maurice Wilkins were awarded the 1962 Nobel Prize in Physiology or Medicine “for their discoveries concerning the molecular structure of nucleic acids and its significance for information transfer in living material” (Wikipedia, James_Watson, 2020) The author’s contribution to DNA human genome mapping project was merely running a gas chromatograph and summarizing datasets for the “suits.” But I met the top guns at a celebration of Nobel Prize in the auditorium. My point – the DNA project is a terrific example of the application of the scientific method. The reference also details the methodology. (Wikipedia, Scientific Method, 2020)
[6] Note there is no political, financial influence or consensus required in this definition.
[7] Cooks’ team has 12 volunteers who classify themselves as activists and 9 of them have no training at all in any science.
[8] Agnotology is defined as the study of how ignorance arises via circulation of misinformation calculated to mislead.
[9] It appears that Cook and his co-authors manipulated the data to present an altogether untrue narrative of overwhelming support for catastrophic human-caused warming.
[10] Try to recognize the bias, hysteria, and lack of scientific basis in this status quo approach. Look at the inflammation in the words.
[11] Seems to me that nuclear war at the instigation of hostile nations or complete economic failure of society might rank fairly high.
[12] See Nichols CUAS textbook (2020) for a complete description and frequency allocation of the EMS and small the near-infrared spectrum is in terms of the entire allocation of frequencies. (Nichols R. K., et al., 2020)
[13] Fahrenheit is the authors choice, but the world adores Celsius. Engineers can work with both F or C. o F = 1.8 (o C) +32
[14] Photosynthesis is the process by which green plants and some other organisms use sunlight to synthesize foods from carbon dioxide and water. Photosynthesis is important to living organisms because it is the number one source of oxygen in the atmosphere. Green plants and trees use photosynthesis to make food from sunlight, carbon dioxide and water in the atmosphere: It is their primary source of energy. Photosynthesis is usually represented by the equation 6 CO2 + 6 H2O + light –> C6H12O6 + 6 O2. During this process, organisms such as plants go through the light-dependent and light-independent reactions to convert carbon dioxide and water into sugars and oxygen. The O2 produced is used by living organisms as a vital part of the synchronicity of the ecosystem. (Wikipedia, Photosynthesis, 2020)
[15] We will examine some of these extreme weather conditions in this chapter.
[16] All “Facts” statements in blue are based on or quoted from (Wrightstone G. , 2017)
[17] Ed Ring writes for the Climate Disinformation Database, https://www.desmogblog.com/global-warming-denier-database . (Ed Ring, EcoWorld, 2008) Dick Pilard picked up his Letter in Aspentimes https://www.aspentimes.com/opinion/letters-to-the-editor/letter-politics-disguised-as-science/
[18] During the writing of this chapter, the author of (Wrightstone G. , 2017) was suspended for 3 weeks for his anti-global warming opinion piece on LinkedIn. I personally felt that Linkedin was the last bastion of reasonable professional level discussions. Such censorship and non-acceptance of differing professional opinions on key issues is common place to the level of vulgarity on Twitter and Facebook. Their leaders are under investigation by Congress. It is most disappointing that a professional network like Linkedin should join the anti-FOS crowd. (Author opinion only) It behooves us to remember that science is NOT consensus and consensus is not science. Another interesting issue is does the First Amendment apply to publicly held social networking corporations. Evelyn Beatrice Hall wrote the phrase: “I disapprove of what you say, but I will defend to the death your right to say it.” (Tallentyre, 1906) This quotation – which is sometimes misattributed to Voltaire himself – is often cited to describe the principle of Freedom Of Speech. (Boller & George, 1989)
[19] This included the Modern, Medieval, Roman, Minoan, Egyptian Old Kingdom and Holocene climate optima periods.
[20] The author has reviewed all four documents. The counterattack on MM claims by an anonymous “mike @ 4 December 2004” has some interesting points but hiding from the public strains the credibility.
[21] The Best figure is better representation of CET data than Figure I-24 in (Wrightstone G. , 2017) However, there many images covering the same CET / Hadley dataset and some showing declining warming. This contradiction can be resolved by presentation XY scales and units.
[22] LIA = Little Ice Age (1250-1850)
[23] The Flannigan team further attributed the decline in wildfires to the combined effect of CO2 fertilization and rising temperature, leading to greater soil moisture.
[24] For a tornado to be counted, it must be observed. Early records and evidence of tornadoes – even in Tornado Alley – are unreliable for the sparsely populated early 20Th century. (NOAA, NOAA NCEI Historical Records and Trends, 2017)
[25] CO2 emissions per bmt previously shown in Figure 7.8. (Boden TA, 2016)
[26] Bmt = billions of metric tons
[27] Insufficient range = “cherry picking the data”
[28] Keep looking because there are active efforts to censor any dissent. Scientific inquiry and discoveries are not political tools, they are the basis of intelligent life.
