11 Civilian use of Space for Environmental, Wildlife Tracking, & Fire Risk Zone Identification (Ryan)
This chapter provides an overview regarding how an increasing variety of civilian uses of space is transforming terrestrial activities such as monitoring endangered species, tracking environmental changes, and providing fire risk management support. The global perspective made possible from the high ground of space has transformed and enriched many civilian activities, providing more, different, and better data that contributes both to the science and to the practice of these activities.
Student Learning Objectives
After reading this chapter, students should be able to do the following:
- Define cislunar space
- Describe how satellites are used for a variety of civilian uses
Introduction
The first venturing of humankind out of our earthly atmosphere required harnessing the capabilities and resources of nation-states to accomplish. In the United States, the intentional use of space for civilian purposes was declared in the National Aeronautics and Space Act of 1958: “it is the policy of the United States that activities in space should be devoted to peaceful purposes for the benefit of all mankind”. (Hudson, 1990) Since then, the National Aeronautics and Space Agency (NASA) has systematically expanded the civil use of space, often in cooperative efforts with other nations. As a result, the impact of space technology is extensive, touching on nearly every aspect of modern life. In this chapter, three applications are specifically explored, with the caveat that these are but three of the broad uses of space-based resources to augment the terrestrial based efforts that we humans use to make life better.
In this chapter, the part of space discussed is that part called cislunar (also spelled cis-lunar), which is to say that area extending from near-Earth space to the Moon’s orbital sphere (Holzinger, Chow, & Garretson, 2021). The specific definition of cislunar space is: “Cislunar space is the area around the Earth extending out to just beyond the Moon’s orbit, and including all of the five Lagrangian points that are stable in position in reference to the Earth and Moon as they rotate about each other.” (The Space Option, 2012) Figure 11-1 shows a graphical description of cislunar space, annotated with common orbits, L1, and L2 for reference. The acronyms are defined here:
- LEO: low earth orbit, which is between 160 and 2,000 km above the earth’s surface (CSIS, 2017)
- MEO: middle earth orbit, which is between LEO and GEO(CSIS, 2017)
- GEO: geosynchronous orbit, which orbit at 35,786 km(CSIS, 2017). (Note that this use of the acronym GEO should not be confused with the Group on Earth Observations, also referred to as GEO.)
- HEO: highly elliptical orbit, which orbit along an oblong rather than a circular path for greater dwell time over a part of the earth (CSIS, 2017)
- LLO: low lunar orbit is approximately 100 km above the lunar surface(Parker & Anderson, 2013)
- L1 and L2: “Lagrange points are caused by the balance between the gravitational fields of two large bodies; equilibria between two pulling forces.”(CSIS, 2017)
Figure 11-1 Cislunar Space
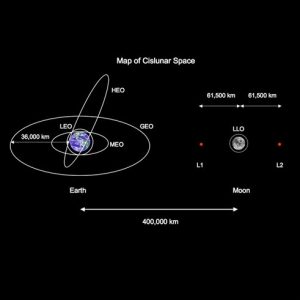
Source: (The Space Option, 2012)
There are five Lagrange points, referred to as Lx, where x is the numeric designator. “L1 lies between Earth and the sun at about 1 million miles from Earth; L2 also lies a million miles from Earth, but in the opposite direction of the sun.” (Howell, 2017) These points are shown graphically in Figure 11-2.
Figure 11-2 Lagrange Points
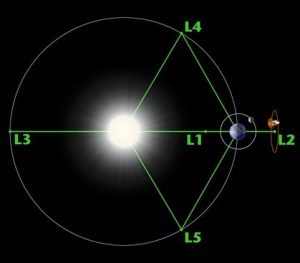
Source: (Howell, 2017)
In cislunar space, there can be earth-orbiting systems, moon-orbiting systems, and moon-based systems, as well as systems that transit both orbital systems. The orbital and moon-based systems may be manned or unmanned. Sensors incorporated into these systems may be passive, such as telescopes and antennas, or active, such as radars and lasers. (Holzinger, Chow, & Garretson, 2021)
Applications
The promise of using space-based resources to help understand and manage the environment was an early concept in humanity’s approach to space resources. The high ground of space not only provides an ability to observe a broader swath of the earth’s surface, but it also provides the ability to observe and measure the atmosphere and weather patterns. As a result, early applications included launching satellites with specialized equipment for viewing the earth’s surface, such as LandSat, and for monitoring the weather, such as the Television InfraRed Observational Satellite (TIROS). The TIROS-1 satellite was one of the earliest programs, having been launched in 1960 with the mission to collect weather data. (NASA, 2010) Landsat was launched in 1972 with the mission to collect “data on the forests, farms, urban areas and freshwater” of Earth. (NASA, 2022) From these early efforts, the ability to surveil and study the environment has grown tremendously, contributing to our knowledge and understanding of the planet we live on and the effects that humans have on both the environment and the climate.
Environmental monitoring from space started as a pretty straight-forward proposition: place instruments into orbit around the planet that collect specific types of data, transfer that data-to-data fusion centers, and analyze the information. But as the use of space became normalized, through things like global communications systems, people started to realize that there was more that could be done. Some of these applications included putting tracking devices on animals and placing terrestrial sensors in difficult to monitor locations: the data collected could be sent to satellites and then retransmitted to more convenient or better equipped terrestrial locations. In this approach, the earth-based target of study transmitted data to the satellite for relay. In a different approach, made available through the development of position-locating satellite systems, such as the Global Positioning System (GPS), the target of study receives signals from the satellites, which are then used to identify the locations at measurement intervals. With the increasing sophistication and miniaturization of electronic devices, the application of these general approaches to a wider body of problems has become possible.
Thus, the basic concepts of using space-based systems in applications associated with environmental monitoring include the following approaches:
1) equipping space-based systems, including satellites and orbiting laboratories, with instrumentation suitable for observing aspects of the environment, including climate and terrestrial features;
2) using space-based systems to relay data from terrestrial targets of research to terrestrial data analysis centers; and
3) using space-based systems to send data to terrestrial targets of research for later accession and analysis.
These approaches may also, of course, be used in combinations.
Current Systems
There are many current systems being used for environmental monitoring, wildlife tracking, and fire risk management. The business of observing the Earth is complex and can be expensive. Complicating things is the fact that there are only so many orbital positions: access to space must be coordinated and managed carefully. That makes international cooperation necessary. Such cooperation includes not only national and regional space authorities but also the companies building the sensors and the satellites as well as advocacy groups and researchers who use the resulting data.
Illustrative of the level of cooperation is the Group on Earth Observations (GEO), “is a partnership of more than 100 national governments and in excess of 100 Participating Organizations.” (Group on Earth Observations, n.d.) The focus of GEO is coordinating the development of the Global Earth Observation System of Systems (GEOSS) in order to advance the international community’s ability to collect and use data related to the following topics: biodiversity and ecosystem sustainability, disaster resilience, energy and mineral resource management, food security and sustainable agriculture, public health surveillance, infrastructure and transport management, sustainable urban development, and water resources management. As of 2022, there are 113 member governments representing the vast majority of the Earth’s population. Additionally, there are 143 participating organizations, including those such as the Association of Geospatial Industries, the Arab States Research and Education Network (ASREN), the European Association of Remote Sensing Companies (EARSC), and the World Ocean Council. (Group on Earth Observations, n.d.)
Very large countries, such as the United States, have established systems in place to contribute to the global earth sensing goals. The U.S.’s NASA has a program called the Earth Observation System (EOS) that has spanned decades of effort, including 48 completed missions. There are currently 33 active missions in NASA’s Earth Fleet with an additional 17 missions planned (NASA, 2021). Similarly, the European Space Agency (ESA) has a program of missions for observing the Earth, which started in the 1970s (ESA, 2021), as do China (Jones, 2022) and India ( (Indian Space Research Organization, n.d.)
With such active participation in Earth observation, it is impossible to catalog every effort. However, by looking at examples of activity, one can develop a better understanding of the scope and nature of the activities.
Water-Focused Topics
Water is a very important part of life on Earth. It is not only necessary to sustain life but the water in the oceans, in rivers, and in the atmosphere affect the weather and agricultural. There are many things we need to understand about the Earth’s water, including but not limited to oceanic currents, marine mammals and fisheries, river systems, and sea levels.
Oceanic Currents
Oceanic currents, shown in Figure 11-3, are the rivers that flow through the ocean. Because of temperature and salinity, these currents can flow lower or higher in the oceans, which in turn affect evaporation rates, ice melt, and aquatic life movement. Oceanic currents affect the climate of the Earth, the life in the oceans, and localized ecosystems. Using satellites to monitor oceanic currents provides an important set of data to that being collected through ocean buoys and other terrestrial systems. How the currents actually work is very complicated:
“Winds, water density, and tides all drive ocean currents. Coastal and sea floor features influence their location, direction, and speed. Earth’s rotation results in the Coriolis effect which also influences ocean currents. Similar to a person trying to walk in a straight line across a spinning merry-go-round, winds and ocean waters get deflected from a straight-line path as they travel across the rotating Earth. This phenomenon causes ocean currents in the Northern Hemisphere to veer to the right and in the Southern Hemisphere to the left.” (NOAA, 2011)
Figure 11-3 Oceanic Currents
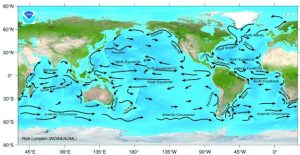
Source: (NOAA, 2011)
Ocean currents are studied to understand how they work, what affects their movement, and how they change over time. In 2012, NASA released a 20-minute video showing how ocean currents had evolved using data from 2005 to 2007. You can watch the video at this link (current August 2022): http://svs.gsfc.nasa.gov/goto?3827. An enormous amount of data was used to make that video. As described in the NASA announcement:
The Estimating the Circulation and Climate of the Ocean (ECCO) … model-data syntheses are being used to quantify the ocean’s role in the global carbon cycle, to understand the recent evolution of the polar oceans, to monitor time-evolving heat, water, and chemical exchanges within and between different components of the Earth system, and for many other science applications. … Data used by the ECCO project include: sea surface height from NASA’s Topex/Poseidon, Jason-1, and Ocean Surface Topography Mission/Jason-2 satellite altimeters; gravity from the NASA/German Aerospace Center Gravity Recovery and Climate Experiment mission; surface wind stress from NASA’s QuikScat mission; sea surface temperature from the NASA/Japan Aerospace Exploration Agency Advanced Microwave Scanning Radiometer-EOS; sea ice concentration and velocity data from passive microwave radiometers; and temperature and salinity profiles from shipborne casts, moorings and the international Argo ocean observation system. (NASA, 2012)
Marine Mammals and Fisheries
Marine mammals, such as sea lions, whales, and seals, are important to understand because they reflect the health of the environment in which they exist. Important data for understanding marine mammal behavior includes tracking where they go, where and when they migrate, and proximity to other species. Some projects using satellites to assist in this research are described here. Figure 11-4 shows marine mammals fitted out with satellite tags that “the movements and location of the animal, dive data (the depth and length of the dive), water temperature and salinity of the water.” (Pacific Marine Mammal Center, 2019)
Figure 11-4 Sea Lions Fitted with Satellite Tags
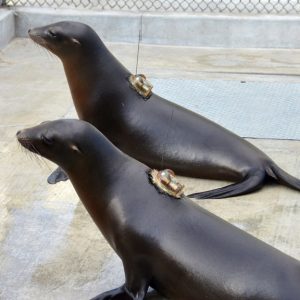
Source: (Pacific Marine Mammal Center, 2019)
The Alaska Ecosystems Program uses satellites to track radio signals from beacons attached to seals and sea lions. Because the animals swim hundreds of miles in the far north, a polar-inclined satellite is used to track the beacons. Additionally, another satellite makes it possible to correlate the movement of the animals to places more likely to have concentrations of prey. The combination of this data provides important insight into the health of the species. (JPL, 2001)
Fisheries are an important target for monitoring for several reasons. One reason is simply to monitor the health and sustainability of the fish. Another is to monitor human behavior, such as poaching and illegal fishing. Yet another is to monitor environmental threats to fisheries, such as oil spills. Satellite systems are uniquely placed above the Earth to provide unblinking observation of the activities of humans and of environmental problems. In fact, it was satellite systems that first provided the data that alerted authorities to an oil leak off the California coast in October 2021: imagery data from Landsat 8 and Operational Land Imager (OLI) combined with synthetic aperture radar imagery from Sentinel-1B were used to identify and locate the source of oil that had been discovered on the ocean surface near California a day earlier. The continual monitoring of the environment was key to the timely identification. (NASA, 2021)
River Systems
River systems are the lifeblood of the land. They bring water from mountain snows to farms and seas, they provide fresh water for drinking and agriculture, and they provide a natural movement of sediment from land to sea. But rivers change. Sometimes they change naturally, as when floods carve out new channels or when water sources dry up and rivers disappear. Other times they are changed by man, through dams, canals, or displacement. Satellite systems can track changes to river systems through visual, infrared, and radar imagery as well as through temperature and humidity measurements. In this way, everyday effects on wildlife, fisheries, and humans can be understood and managed.
As an example of satellite support to river management, there is a continual challenge presented to regions by the necessity to manage river dams. There is a specific problem from “excess sedimentation, like sand and gravel from floods or rivers that are deposited downstream into these systems” which “can build up over time, leading to a loss of water storage capacity and damaging hydropower dams, turbines, and water intakes. Sediment-related maintenance and removal costs can account for up to 40% of all maintenance costs.” (Preston, 2022) Figure 11-5 shows “sediment levels before and after a river flushing event at the Verbois hydropower plant in Switzerland.” (Preston, 2022)
Figure 11-5 Monitoring Dam Flushing from Space
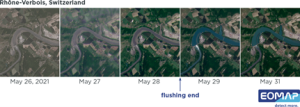
Source: (Preston, 2022)
Disasters are also a challenge. An important part of understanding and managing river systems is understanding precipitation and resulting floods or draughts. Too much rain and rivers flood. Too little rain and rivers, and lakes, dry up. Also, too little rain leads to increased risk of wildfires.
“The Global Precipitation Measurement (GPM) Core Observatory paints a picture of global precipitation every 30 minutes, with help from its other international satellite partners. It has provided innumerable insights into Earth’s precipitation patterns, severe storms, and into the rain and snow particles within clouds. It has also helped farmers trying to increase crop yields, and aided researchers predicting the spread of fires.” (Patel, 2019)
The ability to observe precipitation from space has also led to the development of the concept called “atmospheric rivers”, which are “long, narrow bands of moisture in the air”. (Patel, 2019) The difference between an atmospheric river and a storm is significant: the atmospheric river brings a steady stream of water to an area, just as a terrestrial river brings water to a specific area. It is a not a one-off event but a conveyor belt of moisture. Figure 11-6 shows an atmospheric river stretching from Asia to the West Coast of the North American continent.
Figure 11-6 Atmospheric River Between Asia and North America
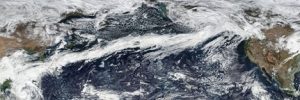
Source: (NASA, 2017)
This photo is a composite of two images taken by “the Visible Infrared Imaging Radiometer Suite (VIIRS) on the Suomi NPP satellite.” (NASA, 2017) The ability to actually see the atmospheric rivers from satellites has had an enormous impact on weather prediction, increasing the ability to predict when an atmospheric river will affect an area.
Sea Levels
There are many things that affect sea level, and it is a very real concern for the life of millions of people who live in threatened areas along coasts and on islands. The scientific community monitors many elements that can affect sea levels, including sea ice and sea temperatures.
“Sea ice is frozen seawater that floats on the ocean surface. It forms in both the Arctic and the Antarctic in each hemisphere’s winter; it retreats in the summer but does not completely disappear. This floating ice has a profound influence on the polar environment, influencing ocean circulation, weather, and regional climate.” (NASA, 2016)
Although melting sea ice does not raise sea levels, because it is already in the water, it has a very important impact on the parts of the climate that can affect sea level: the temperature of the atmosphere and the amount of sunlight that is reflected back into space. Simply put bright white ice is highly reflective. When this ice becomes sooty from pollution, it becomes less reflective. When the ice melts entirely, it is not at all reflective – it doesn’t exist. So, it is very important to understand and monitor sea ice.
“Once sea ice begins to melt, a self-reinforcing cycle often begins. As more ice melts and exposes more dark water, the water absorbs more sunlight. The sun-warmed water then melts more ice. Over several years, this positive feedback cycle (the ice-albedo feedback) can influence global climate.” (NASA, 2016)
Sea ice is monitored through satellite imagery, radar, and infrared systems.
Monitoring sea levels is an important part of knowing how the levels are trending. These are also monitored from space through imagery and radar systems. Figure 11-7 shows a conceptual artist rendition of how radar altimetry technology is used to gather precision data on sea levels. (ESA, 2021)
Figure 11-7 conceptual artist rendition of how radar altimetry technology is used to gather precision data on sea levels
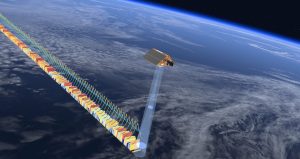
Source: (ESA, 2021)
Land-Focused Topics
Land is, of course, where humans live and primarily operate. Issues associated with land use include natural disasters (including fires and floods) and population density and movements.
Natural Disasters
Large scale natural disasters differ from more localized disaster not only in the scale of the problem but also in the cascading issues that stem from the disaster. For example, the effects of Hurricane Katrina, while devastating to the Gulf Coast and New Orleans specifically, affected the entire oil and gas infrastructure that in turn affected both local and global markets. Monitoring the potential and actuality of a large-scale natural disaster, particularly those that occur in remote locations, is only possible from the high ground of space. NASA uses satellites to detect and monitor “global intensive risk events that span a range of natural hazards — not only wildfires but earthquakes, tsunamis, floods, landslides, severe weather, winter storms, tropical cyclones and volcanoes.” (NASA, 2022) Since it is a global issue, there has been a focus on international cooperation in these efforts, leading to the development of “infrastructure and … new relationships between international, regional and local natural disaster response agencies and other Earth-observing space agencies around the world.” (NASA, 2022)
Population Density and Movements
There are a lot of people on this earth and the competition for resources is stiff. Simply knowing where humans live a difficult question can be and yet it is critical for understanding how to create programs and policies to address issues like food security and disaster management. The European Space Agency has created a program designed to bring the power of space to mapping the global human footprint. The program, named the World Settlement Footprint, provides “continuous data streams of high quality and free of charge satellite observations such as the Sentinels of the European Copernicus program and the Landsat missions” in order to “monitor the changes and trends in urban development globally.” (ESA, 2021) A sibling program, called the Global Urban Footprint, “shows not just urban centers, but also tiny rural hamlets.” (ESA, 2016) Figure 11-8 shows a view of Europe provided by this effort.
Figure 11-8 View of Europe – Global Urban Footprint
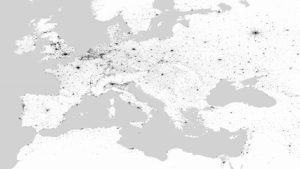
Source: (ESA, 2016)
Organizations are also using satellites to track human movements and identify areas in which human rights are being violated. “For example, across south Asia, there is a vast “Brick Belt” — a network of tens of thousands of brick kilns that employ some 23 million workers across India, Nepal, and Pakistan [that may be] rife with debt-bondage and child slavery.” (Zolli, 2018) “Researchers at the Rights Lab recently used satellite imagery and machine learning techniques to map the entire Brick Belt in unprecedented detail.” (Zolli, 2018) Figure 11-9 shows this map.
Figure 11-9 Map The Entire Brick Belt
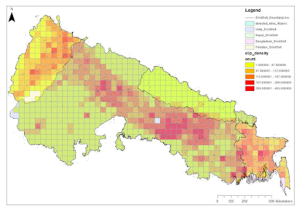
Source: (Zolli, 2018)
These same techniques are being used to integrate many types of data to understand how humans move and why, such as linking movements to wide scale war, drought, or other issues.
Atmosphere Focused Missions
The makeup of the atmosphere controls how much radiation we are exposed to, how much heat is reflected from the Earth into space, and how well plants and animals survive on the planet. Issues with the atmosphere are extremely varied but also include lightning, atmospheric gases, the ozone layer, and the radiation shield.
Lightning
Monitoring lightning strikes around the world is more important than simply keeping track of them. “Lightning is a surprisingly elusive and complex natural phenomenon for the impact that it has on our daily lives. We are now at a place where we have excellent measurements of its many facets, which allow us to discover surprising new aspects of its behavior.” (World Meteorological Organization, 2022)
Understanding the underlying phenomenon is key to prediction. Tracking lightning from space has not only assisted in gathering data to support research into lightning, but it has also expanded our knowledge of the many forms in which lightning occurs.
“Recent advances in space-based lightning mapping offer the ability to measure flash extent and duration continuously over broad geospatial domains. These new instruments include the Geostationary Lightning Mappers (GLMs) on the R-series Geostationary Operational Environmental Satellites (GOES-16 and 17) …, and their orbiting counterparts from Europe (the Meteosat Third Generation (MTG) Lightning Imager) and China (FY-4 Lightning Mapping Imager).” (World Meteorological Organization, 2022)
For example, it is now known that some storms can produce giant jets of lightning that go up to the edge of space. Figure 11-10 shows a recent example of one such jet, captured by the International Space Station in 2019.
Figure 11-10 Example Of One Such Jet, Captured By The International Space Station In 2019
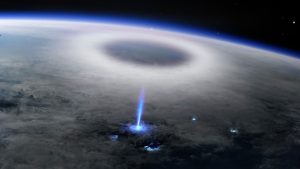
Source: (Temming, 2021)
“Blue jets have been observed from the ground and aircraft for years, but it’s hard to tell how they form without getting high above the clouds.” (Temming, 2021) One can imagine the damage if one of these lightning bolts hit a satellite or an airborne system. They can also “affect how radio waves travel through the air — potentially impacting communication technologies.” (Temming, 2021)
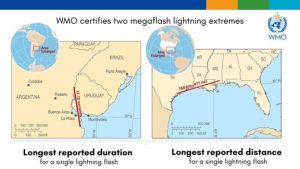
There is also a phenomenon called “megaflash” lightning, where a single flash of lightning occurs across a very large area. The World Meteorological Organization (WMO) certified two new records for megaflash lightning events in 2022 thanks to the ability to harness satellite technology to observe large areas of storms from above. These two records were for the largest area covered and for the longest duration of a single flash.
“The longest single flash that covered a horizontal distance of 768 ± 8 km (477.2 ± 5 miles) across parts of the southern United States on 29 April 2020. This is equivalent to the distance between New York City and Columbus Ohio in the United States or between London and the German city of Hamburg. The greatest duration for a single lightning flash of 17.102 ± 0.002 seconds from the flash that developed continuously through a thunderstorm over Uruguay and northern Argentina on 18 June 2020.” (World Meteorological Organization, 2022)
Figure 11-11 shows the location of the two record breaking strikes.
Figure 11-11 Record Breaking Mega-flash Lightning Events
Source: (World Meteorological Organization, 2022)
Atmospheric Gases and Particulates
Atmospheric gases pay a critical role in the survival of plants and animals on the earth. Most fundamentally, animals need a certain amount but not too much oxygen to survive. Too much oxygen can be deadly as well as a serious fire hazard. Plants need a certain amount but not too much carbon dioxide to survive. Too much carbon dioxide can be deadly as well as contributing to global climate change. Beyond the actual mixture of the gases in the air, there is also the question of particulates in the air. It is natural to have some dust and other microscopic things in the air but too much can lead to serious issues, such as lung cancer and acid rain. (World Health Organization, 2022)
Monitoring atmospheric gases has been a scientific focus for several hundred years. In 2023, a step forward will be taken with the launch of the first Carbon Mapper satellite. “The Carbon Mapper’s Earth-orbiting imaging spectrometer will have a pixel size of about 30 meters (98 feet) square. Other imaging spectrometers currently in orbit have larger pixel sizes, making it hard to pinpoint the locations of sources that may not be visible on the ground, such as cracks in natural gas pipelines.” (NASA, 2021) Figure 11-12 shows an example of the type of data that can be collected from space. This image was captured from the same types of sensing systems in an airborne platform.
Figure 11-12 Gas Plumes Captured with the Global Airborne Observatory over the Permian Basin in 2019
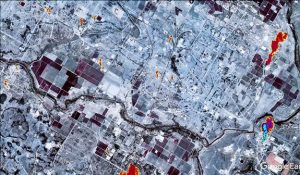
Source: (NASA, 2021)
Particulates come from both liquid air and material. Some of them naturally flow with the air currents over the earth, sometimes being precipitated out during storms. In some places, however, particulates can stay localized for long periods of time and cause problems to human health, crop cultivation, and even electronics.
“Aerosol particle pollution—airborne solid particles and liquid droplets—comes in a range of sizes. Particles smaller than 2.5 micrometers pose the greatest risk to human health because they are small enough to be breathed deep into the lungs and, in some cases, enter the blood stream. These fine particles, about 30 times smaller than the width of a human hair, are also a major cause of poor visibility.” (NASA, 2010)
It is important to realize that the vast majority of particulates come from natural sources, such as volcanoes, forest fires, and even plants. However, the naturally produced particulates tend to be larger sized. Manmade particulates tend to be smaller and more pervasive where humans live.
“Automobiles, incinerators, smelters, and power plants are prolific producers of sulfates, nitrates, black carbon, and other particles. Deforestation, overgrazing, drought, and excessive irrigation can alter the land surface, increasing the rate at which dust aerosols enter the atmosphere. Even indoors, cigarettes, cooking stoves, fireplaces, and candles are sources of aerosols.” (NASA, 2010)
What is in the air can move with the wind. Pollution in one region can spread to other regions. It is a global issue. Treating it like a global issue requires a global surveillance ability. This simply cannot be done from the ground since some countries lack the resources to collect data. While “satellites [can] provide a global perspective, satellite instruments have generally struggled to achieve accurate measurements of the particles in near-surface air. The problem: Most satellite instruments can’t distinguish particles close to the ground from those high in the atmosphere. In addition, clouds tend to obscure the view. And bright land surfaces, such as snow, desert sand, and those found in certain urban areas can mar measurements.” (NASA, 2010) This problem has been partially solved by fusing multiple sources of data and by the deployment of better sensing systems. As a result, it is possible to create a global view of particulates in Earth’s atmosphere, as shown in Figure 11-13. This image shows a global satellite-derived map of PM2.5 averaged over 2001-2006.
Figure 11-13 Global Satellite-Derived Map Of PM2.5 Averaged Over 2001-2006.
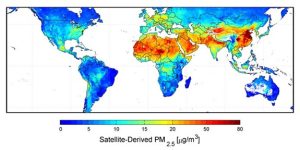
Source: (NASA, 2010)
Ozone layer
The ozone layer is critical to life on earth as we know it, since it “blocks UV radiation that can damage living tissue, including plants.” (NASA, 2021) The Ozone Monitoring Instrument (OMI) is an international collaborative project that brings together scientists and space agencies to collect data in order to understand how to measure challenges to the ozone layer and to develop countermeasures that are actually effective. It “measures criteria pollutants such as nitrogen dioxide (NO2), sulfur dioxide (SO2), bromine oxide (BrO), and aerosol characteristics … [and] provides mapping of pollution products from an urban to super-regional scale.” (NASA, 2022)
Magnetic shield
The earth’s magnetic shield is a product of the electrical currents that run through the Earth. Also known as the “magnetoshield,” it is a critical protective barrier shielding the Earth from sunspots and other radiative hazards. Figure 11-14 portrays an artistic conception of the magnetosphere.
Figure 11-14 Portrays An Artistic Conception Of The Magnetosphere
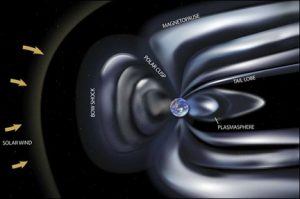
Source: (Buis, 2021)
The magnetosphere is constantly changing, however, because the molten core of Earth, which generates the currents that create the magnetic north and south poles, is constantly moving and even occasionally flipping over. The more immediate issue is when space weather causes “geomagnetic storms that can penetrate our atmosphere, threatening spacecraft and astronauts, disrupting navigation systems and wreaking havoc on power grids.” (Buis, 2021) Monitoring the magnetosphere can provide some advance warning of such events as well as contribute to our understanding of how the greater system works. Satellites are crucial to this effort. One such effort is from the European Space Agency, which launched a 3 satellite “Swarm constellation [to provide] new insights into the workings of Earth’s global magnetic field.” (Buis, 2021)
References
Buis, A. (2021, August 3). Earth’s Magnetosphere: Protecting Our Planet from Harmful Space Energy. Retrieved August 12, 2022, from NASA Global Climate Change: https://climate.nasa.gov/news/3105/earths-magnetosphere-protecting-our-planet-from-harmful-space-energy/
CSIS. (2017, November 30). Popular Orbits 101. Retrieved August 7, 2022, from Aerospace Security: https://aerospace.csis.org/aerospace101/earth-orbit-101/
ESA. (2016, November 18). New map offers precise snapshot of human life on Earth. Retrieved August 12, 2022, from ESA Observing the Earth: https://www.esa.int/Applications/Observing_the_Earth/New_map_offers_precise_snapshot_of_human_life_on_Earth
ESA. (2021, January 19). ESA-developed Earth observation missions. Retrieved August 8, 2022, from European Space Agency: https://www.esa.int/Applications/Observing_the_Earth/Earth_observing_missions
ESA. (2021, November 11). Mapping our human footprint from space. Retrieved August 12, 2022, from ESA Observing the Earth: https://www.esa.int/Applications/Observing_the_Earth/Mapping_our_human_footprint_from_space
ESA. (2021, June 26). New Sea-level Monitoring Satellite Goes Live. Retrieved August 12, 2022, from ESA / Applications / Observing the Earth / Copernicus / Sentinel-6: https://www.esa.int/Applications/Observing_the_Earth/Copernicus/Sentinel-6/New_sea-level_monitoring_satellite_goes_live
Group on Earth Observations. (n.d.). About Us. Retrieved August 8, 2022, from Group on Earth Observations: https://www.earthobservations.org/geo_community.php
Holzinger, M. J., Chow, C. C., & Garretson, P. (2021, May 3). AFRL Portal. Retrieved August 7, 2022, from A Primer on Cislunar Space: https://www.afrl.af.mil/Portals/90/Documents/RV/A%20Primer%20on%20Cislunar%20Space_Dist%20A_PA2021-1271.pdf?ver=vs6e0sE4PuJ51QC-15DEfg%3D%3D
Howell, E. (2017, August 21). Lagrange Points: Parking Places in Space. Retrieved August 7, 2022, from Space.com: https://www.space.com/30302-lagrange-points.html
Hudson, K. E. (1990). Communications Satellites: Their Development and Impact. New York, NY: Macmillan Inc.
Indian Space Research Organization. (n.d.). Earth Observation Applications. Retrieved August 8, 2022, from Indian Space Research Organization: https://www.isro.gov.in/earth-observation/applications
Jones, A. (2022, July 1). China launches new Gaofen 12 Earth observation satellite. Retrieved August 8, 2022, from Space.com: https://www.space.com/china-launches-gaofen-12-satellite
JPL. (2001, November 3). Joint Propulsion Lab. Retrieved August 9, 2022, from Seals, Sea Lions and Satellites: https://www.jpl.nasa.gov/news/seals-sea-lions-and-satellites
NASA. (2010, November 9). Global View of Fine Aerosol Particles. Retrieved August 12, 2022, from NASA Earth Observatory: https://earthobservatory.nasa.gov/images/46823/global-view-of-fine-aerosol-particles
NASA. (2010, September 22). New Map Offers a Global View of Health-Sapping Air Pollution. Retrieved August 12, 2022, from NASA Earth Observatory: https://www.nasa.gov/topics/earth/features/health-sapping.html
NASA. (2010, April 1). TIROS, the Nation’s First Weather Satellite. Retrieved August 6, 2022, from NASA History: https://www.nasa.gov/multimedia/imagegallery/image_feature_1627.html
NASA. (2012, April 9). NASA Views Our Perpetual Ocean. Retrieved August 9, 2022, from NASA: https://www.nasa.gov/topics/earth/features/perpetual-ocean.html
NASA. (2016, September 16). Sea Ice. Retrieved August 9, 2022, from NASA Earth Observatory: https://earthobservatory.nasa.gov/features/SeaIce/page1.php
NASA. (2017, October 26). A River of Rain Connecting Asia and North America. Retrieved August 12, 2022, from NASA Earth Observatory: https://earthobservatory.nasa.gov/images/91175/a-river-of-rain-connecting-asia-and-north-america
NASA. (2021, June 23). Earth Observing System Project Science Office. Retrieved August 8, 2022, from NASA: https://eospso.nasa.gov/content/nasas-earth-observing-system-project-science-office
NASA. (2021, April 15). NASA-Built Instrument Will Help to Spot Greenhouse Gas Super-Emitters. Retrieved August 12, 2022, from NASA: https://www.nasa.gov/feature/jpl/nasa-built-instrument-will-help-to-spot-greenhouse-gas-super-emitters
NASA. (2021, August 25). Protecting the Ozone Layer Also Protects Earth’s Ability to Sequester Carbon. Retrieved August 12, 2022, from NASA: https://www.nasa.gov/feature/goddard/esnt/2021/protecting-the-ozone-layer-also-protects-earth-s-ability-to-sequester-carbon
NASA. (2021, October). Satellites View California Oil Spill. Retrieved August 9, 2022, from NASA Earth Observatory: https://earthobservatory.nasa.gov/images/148929/satellites-view-california-oil-spill
NASA. (2022, July 22). 50 Years of Landsat. Retrieved August 6, 2022, from NASA History: https://www.nasa.gov/image-feature/50-years-of-landsat
NASA. (2022). Aqua Earth-observing Satellite Mission. Retrieved August 8, 2022, from NASA Earth Observing Systems: https://aqua.nasa.gov
NASA. (2022). NASA Covers Wildfires Using Many Sources. Retrieved August 12, 2022, from NASA Earth Observatory: https://www.nasa.gov/mission_pages/fires/main/missions/index.html
NASA. (2022). Ozone Monitoring Instrument (OMI). Retrieved August 12, 2022, from NASA Aura: https://aura.gsfc.nasa.gov/omi.html
NOAA. (2011, August 1). Ocean Currents. Retrieved August 9, 2022, from National Oceanic and Atmospheric Administration (NOAA): https://www.noaa.gov/education/resource-collections/ocean-coasts/ocean-currents
Pacific Marine Mammal Center. (2019, January 2). Satellite Tracking. Retrieved August 12, 2022, from Pacific Marine Mammal Center: https://www.pacificmmc.org/satellite-tracking
Parker, J. S., & Anderson, R. L. (2013, July). Transfers to Low Lunar Orbits. Retrieved August 7, 2022, from JPL DESCANSO Book Series: https://descanso.jpl.nasa.gov/monograph/series12/LunarTraj–05Chapter4TransferstoLowLunarOrbits.pdf
Patel, K. (2019, March 1). 5 Stories from 5 Years of Precipitation Measurements from Space. Retrieved August 9, 2022, from NASA Earth Observatory: https://earthobservatory.nasa.gov/blogs/earthmatters/2019/03/01/5-stories-from-5-years-of-precipitation-measurements-from-space/
Preston, S. (2022, April 26). Monitoring River Flushing And Hydropower From Space. Retrieved 2022, from Planet Pulse: https://www.planet.com/pulse/monitoring-river-flushing-and-hydropower-from-space/
Temming, M. (2021, January 21). Space Station Detectors Found the Source of Weird ‘Blue Jet’ Lightning. Retrieved August 12, 2022, from Science News: https://www.sciencenews.org/article/space-station-detectors-found-source-weird-blue-jet-lightning
The Space Option. (2012, October 1). Cislunar Space. Retrieved August 7, 2022, from The Space Option: https://thespaceoption.com/portfolio/cislunar-space/
World Health Organization. (2022). Air Pollution. Retrieved August 12, 2022, from WHO Health Topics: https://www.who.int/health-topics/air-pollution#tab=tab_1
World Meteorological Organization. (2022, February 1). WMO certifies two megaflash lightning records. Retrieved August 12, 2022, from World Meteorological Organization: https://public.wmo.int/en/media/press-release/wmo-certifies-two-megaflash-lightning-records
Zolli, A. (2018, December 10). Monitoring Human Rights from Space . Retrieved August 12, 2022, from Planet: https://medium.com/planet-stories/monitoring-human-rights-from-space-a07b0a8cb613
