6 Analyzing Data from Your Classroom
ESSENTIAL QUESTIONS
- What are the best ways to organize and analyze your data?
- What methods of data analysis will be most effective for your study?
- What claims can you make after analyzing your data?
- How do your claims contribute to the knowledge base?
You’ve determined the methods for data collection and then collected that data for your action research project. It is now time to conduct the analysis of your data, which precedes drawing conclusions and sharing your findings. During your action research project, you have been informally analyzing your data and now you can formally analyze to develop findings and reflect on their implications for practice. This will also provide an opportunity to identify unanswered questions and possible new directions. As an action researcher, you will create a coherent and reliable story from all the data collected. This is a key part of the professional development or professional learning aspect of action research. As an action researcher, you are looking to create meaning from your practice by utilizing rich descriptions and narratives, and you are developing expertise by examining situations closely and analyzing them.
Beginning the Meaning Making Process
Before you begin your data analysis, you should revisit the intended goals of the project. Equally, you should think about your research question and reacquaint yourself with your literature review to clearly envision what you have been investigating and why. The goal of data analysis is to identify themes and patterns to provide robust evidence for any claims you are able to make from your findings. You will need to look at the data you have collected from several sources and relate these to your original, expected, outcomes. Of course, you will also be mindful of unexpected outcomes which may be of significance to your study too. Your conclusions should relate to the original intended objectives of the study. Again, your literature review will also help with the analysis, and it will provide distinctions in terms of what we know and don’t know as a field of study. Your findings should either confirm previous literature or provide new knowledge in relation to previous literature.
During this stage of the project, it is also important for you to reflect on the research process itself. Did your project go as planned? What would you do differently? What were the biggest challenges? For those interested in your study, they will be interested in knowing about your challenges, as well as your successes.
Organizing your Data
You will want to make a note of everything you possibly can when you collect data. As you organize your data, take a look at the notes or personal journal you have kept during your data collection period. Your notes may reveal that you have initiated important data analysis in the time and space of collecting the data. This sort of analysis could be personal notes on the themes which related to your original research aims and questions. You may have even made determinations about whether to gather additional data. More importantly, you may have noted some unanticipated themes or ideas that emerged during data collection. I think it is valuable to put these things to the front of your mind as you organize your data and begin the analysis stage.
Analysis and Presentation of your Data
I would like to address some general issues related to analyzing and presenting your data. Here are links to specific examples of data analysis in four action research articles, in the journal Networks: An Online Journal for Teacher Research. These are not necessarily ideal examples, but they provide a variety to spark thinking about your own study and discussion among your classmates.
Using quantitative data
You may have collected some quantitative data to provide demographic, contextual, or academic background for your study. Quantitative data helps support, supplement, and complement the qualitative data you have collected. While it is likely that you have not collected a massive amount of quantitative data, any amount will support a stronger argument. You should be able to analyze and represent the quantitative data using tables or charts. Computer software, such as Microsoft Excel, is suitable for this purpose, and can even handle basic correlations between multiple sets of data (e.g., gender and test scores). If an action research project involves several sites and the data are extensive, you may consider using a statistical package, such as IBM’s SPSS. Your quantitative data can be presented in charts and graphs developed by these programs. Including charts and graphs is worthwhile for two reasons. First, a visual representation is often easier for many readers to understand when digesting data-based information. Second, visual representations break up continuous narratives which can useful when conveying a considerable amount of numerical data and the subsequent correlations. Visual representations can also be an effective way to present qualitative data, or to at least give the reader a glimpse or preview of the data as a whole representation before reading the narrative.
Using qualitative data
Since your action research project was probably located within your professional context and focused on your practice, you likely explored attitudes, behaviors, and feelings that required collecting qualitative data. Most of this data will be in the form of descriptive text or short answer text, which you will need to analyze and interpret. For qualitative data, analysis of the text will require you to develop an analytical framework to use as the basis of analysis. This framework can also be subjective, so being clear and upfront about your framework is important for validity and reliability. If your data collection resulted in a large amount of descriptive text, it may seem overwhelming to analyze. This is quite normal for a qualitative study and having a lot of data means that you will have plenty to work from. If you have a considerable amount of descriptive data, you could use computer software (as outlined later in this chapter) which is relatively simple to use.
Transcription of your data is something that is often overlooked, or avoided, for several reasons. For some types of data collection (e.g., interviews, focus groups, discussions, etc.) it is useful to have the recording transcribed so that you can analyze the text more easily than listening to the recording. Transcribing is often avoided because of time constraints (or because the researcher cannot afford to have someone transcribe for them). However, if you are going to analyze the data, you should not think of it as purely transcription – it is your first opportunity to engage with the data. This will facilitate a more efficient process of analysis as it will more than likely be the second time you have engaged with the data. If you have previewed or already experienced the data, to save time you might transcribe only the parts that are pertinent to the study or your interest.
Analyzing qualitative data
For better, or worse, there is no universally correct way to analyze qualitative data; however, it is important to be systematic in your method of analysis. As I mentioned earlier, your data analysis probably started initially during your data collection. The questions you asked, the frameworks that you used, and the types of documents you collected would have provided some themes and categories that naturally developed as part of this process. I have suggested to new researchers a step-by-step approach to help them get started:
-
- Organize your data. Begin by listing the different sets of data you have collected, show how they are related, and how they will support each other (triangulation).
- Read the content. You need to read the data, probably several times, to develop a sense of what the data are indicating. All your data – observation notes, field diaries, policy documents and so on – need to be looked at. Common words and themes should start to emerge.
- Highlight relevant sections and aspects of the data.
- Develop categories to sort evidence. As you examine the data you will need to use actual evidence (numbers, actual quotes, artifacts, etc.) from your data to support your claims. You want these pieces of evidence to be the most vivid or clear representation for the categories you develop. For example, if you interviewed fifteen students and twelve of the interview transcripts provided evidence that the students’ understanding had grown due to your instructional intervention, you would want to note that twelve of fifteen students interviewed demonstrated growth in understanding, and possibly provide a quote or sample of how this was demonstrated from one of those twelve students. This sort of evidence enhances the trustworthiness of your findings.
- Code your data. Codes will develop from the categories you use to sort the evidence you find in the range of data. Codes also help you when you do a second or third analysis of the data as it guides your examination of the data. (Coding is discussed later in this chapter.)
- Review and narrow the codes. You may begin with a lot of initial codes, but you will want to narrow these to the most significant, well-evidenced, or best triangulated data. Most likely, these narrow codes will become the significant themes to report on your study.
- Interpret your findings. Once you have narrowed your codes, and have evidence in place to support those codes, it is time to interpret the data and develop meaning within the context of your study, and field. This is where your literature review will be useful again.
- Validate the findings. Validation, in addition to this process (see figure 6.1 below), can take many forms. In previous chapters, I had discussed using critical friends to confirm the validity of your interpretations.
- Create report and plan dissemination.
A framework for qualitative data analysis and interpretation
If you are feeling a bit overwhelmed by the amount of qualitative data you collected, you may find Creswell’s (2009) framework to analyze and interpret qualitative data useful (See figure 6.1).
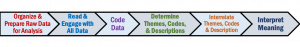
Figure 6.1 Qualitative Data Analysis, interpreted from Creswell (Creswell, 2009, p. 185)
Similarly to above, Creswell also proposes a step-by-step approach to provide practitioners with a guide to undertake action research. I have summarized this in the following section.
Step 1. Organize the data for analysis. You will need to transcribe interviews, scan material, type up your notes, and sort or arrange the different types of data.
Step 2. Read all the data thoroughly. Get a general sense of the data and reflect on their overall meaning. You may have received an initial impression from the data collection, but make notes in the margins or spaces and record any other initial thoughts at this stage.
Step 3. Begin detailed coding and analysis. Coding organizes the material into meaningful chunks of text. When coding, think about:
-
-
- code based on previous literature and common sense;
- code what is surprising and unanticipated;
- code for the unusual which may be of conceptual interest to readers.
-
You may want to hand-code the data, use highlighting colors, or cut and paste text segments onto cards. You may also use a computer software package to help to code, organize and sort the information (e.g., NVivo)
Step 4. Codes should be representative of the categories, topic, setting, or people that are part of the analysis. Creswell suggests generating 5-7 categories. These will be supported with quotations and specific evidence form the data and may represent headings in your report.
Step 5. Decide how you will represent the codes, themes, and descriptions in the narrative. The narrative will summarize the findings from the analysis. This could be a discussion that outlines the project chronologically, a detailed discussion of several themes (including sub-themes, specific illustrations, multiple perspectives from individuals, and quotations), or a discussion with interconnecting themes. Visuals, graphs, figures, or tables are also useful to support the discussion.
Step 6. This final step involves making an interpretation or deriving meaning from the data. Meaning might come from, but is not limited to, lessons learned from the data. Meaning can also be derived when comparing findings to the literature or theories from the literature review.
Positionality and qualitative data
When analyzing qualitative data, the issue of your own positionality will need to be addressed. Positionality was mentioned in a previous chapter; however, addressing your positionality involves how your own social identity and experiences may impact your interpretation of the data. For example, an educator-researcher may have complex identities that they need to be aware of when they are analyzing the data. As a privileged white male with a terminal degree of education, I have to realize I may not fully relate to the experiences of many of my students, and this is important if I am analyzing the attitudes and beliefs of my students. I need to keep that under consideration throughout the research process, but especially as a I deriving meaning from the perspectives of my students. Therefore, positionality is very important for an educator-researcher who is planning and implementing action in a classroom, while they are also a teacher. It is also important to consider the possible impact of being an educator-researcher and acknowledge the possible influence this may have on the interpretations they make and any bias which may influence the research process. Qualitative research is interpretive research with the researcher typically involved in a sustained and intensive experience with the participants, which opens up a range of potential ethical and personal issues into the qualitative research process.
Many action research reports include a section on positionality, in which the researchers write a narrative describing their positionality and keep that visible as they analyze data. Below are some questions regarding what would constitute a positionality statement:
Positionality Statements
- Who am I? (Including demographics, epistemologies and philosophies, journey in education, etc.)
- What do I believe about teaching/learning?
- What do I believe about this topic?
- What are my expectations of this study?
- What are my connections or dis-connections with the participants?
- What are my experiences with the context of this study?
Analysis with computer software
It is now common for data to be analyzed using computer software. However, as Mertler (2008) notes, it is a misconception to think that the software will do the analysis, as data analysis still requires the use of inductive logic, and therefore, advanced technologies cannot take the place of the human brain. Computer software primarily helps researchers organize and store data. Software such as NVivo can also provide very efficient systems for coding a lot data, as well as many different types of data, including social media and video. Software like NVivo can be expensive for an educator-researcher. There are several free and/or cheaper applications and software that provide many of the same features.
Coding
Coding your data is such an important part of the analysis process, I want to devote a bit more discussion to the process. Simply put, coding entails identifying the main themes and patterns within your data. Coding is meant to help you conceptualize and condense your data into meaningful and manageable chunks from which to make conclusions. Coding data can take many shapes and forms. Regardless of how you choose to code your data, it is important to keep your research goals and research questions in the forefront of your mind. After immersing yourself in your data sources, it is possible to feel somewhat overcome by thinking and possibilities sparked by the data. This feeling may be caused by one of two issues you will have to deal with in your analysis. First, it is possible you may think that nearly everything you have collected is relevant and significant to the study, which could lead to some stress in how to determine what to focus on, or what is most significant. Coding should help reduce this stress by bringing patterns and themes to the forefront to help you prioritize some aspects of the data, and make it feel much more manageable. Once you begin to realize you are coding only those things which are relevant, you will ease the stress and begin to enjoy the analysis and coding process. Second, coding can be taxing work because of the constant processing, categorizing, and depth of thinking. Like it is suggested when revising writing, take regular breaks to maintain your full concentration, and in the case of research, to also review your coding criteria.
Using Evidence and Generating Knowledge
The main purpose of gathering data, through a research process, is to provide evidence. In order to provide evidence, you need to analyze the data you have collected. Again, it is important to remember the starting place of your inquiry, and what you are looking for in the study. You began with goals at the start of your research and mapped out your data collection strategically, now you have the data which will provide evidence for articulating your claims and developing pedagogical theories.
Regardless of the type of data you have collected, quantitative data or qualitative data or a combination of the two, ultimately the significance and impact of your research will depend on the quality of data you have collected, the interpretations you make, and your reflections and conclusions. Therefore, the significance of your study will depend upon the quality of the data you have collected and depth of your data analysis.
While you are engaged in data analysis, it might be useful to highlight the data that could be used as evidence to support your claims when you share your research. In the past, I have color coded different types of evidence.
So, what do we mean when we say provide evidence? When researchers provide evidence, they are providing pieces of data that support their claims about what their study did or did not demonstrate. In the next chapter, we will discuss how to share or report your findings. When you share or report you can think of it as an argument that you are making about your findings and subsequent claims. The data is used as evidence to support your claims and strengthen your argument. It is important to remember that to develop valid claims to knowledge, you will need to support your claims with evidence using relevant parts of your data. Therefore, evidence may take the form of survey results, quotes or extracts from interview transcripts, selections from your classroom observation notes, artifacts, photographs, and examples of students’ work.
Generating Knowledge
The purpose of research is to generate new knowledge. As an educator and researcher, the knowledge you produce will be based on your practice. Once you have findings and claims, this will most likely affect your practice. You will articulate knowledge that is generated from how your research has affected your practice and contemplate what significance it may have for other practitioners. This process amounts to you building personal theories about what you have done and demonstrated in your study. Therefore, your theories will emerge from your practice and this will contribute new knowledge to the existing knowledge base. Your data will provide illustrative examples of what happened in your classroom and you will cite relevant evidence. When you develop knowledge from your study, the claims you make and the theories you formulate are original, as you have employed your own critical thinking skills and informed judgement. Your critical thinking and informed judgement are demonstrated in the evidence you provide to validate your claims to knowledge.
Creating Trustworthy Claims to Knowledge
Your research findings and claims to knowledge are much more impactful if demonstrated as trustworthy. Action research is often conducted in collaborative teams, involving communities of educator researchers. Collaborative teams have built in opportunities to increase trustworthiness of studies. Having multiple people make interpretations of the same data creates trustworthiness through common understandings, making the findings more representative. The trustworthiness of research is also based on readers or consumers of your research accept your claims to knowledge. It is scary for many to think they need to validate claims to knowledge, and readers or consumers will critically evaluate their claims. As mentioned in previous chapters, trustworthiness can be accomplished methodologically, and when you report or share your findings you need to simply articulate your methods for trustworthiness. For example:
Achieving Trustworthiness
- Articulate your procedures clearly;
- Explain how you conducted your research thoroughly;
- Describe the robustness of your data collection methods;
- Make clear how triangulation was achieved.
Expect to be challenged on any aspect of your research claims. This is where validation meetings with different groups of people are useful, to have them consider their research processes and findings from different perspectives both during their research and at the conclusion of the project. When you report or share your research, you should include details of your validation meetings and any developments that resulted from these meetings.
Critical Friends can also be useful in regard to trustworthiness. When you establish the project recruit, Critical Friends. Explain that their role is to evaluate all aspects of the research by challenging your assumptions and considering ways to reduce subjectivity and ethical issues. Critical Friends can be helpful in thinking about all aspects of your research, even the implications, usefulness, and replicability of your research. You can utilize Critical Friends either individually or as a group to provide formative feedback at different points of the research.
Data Analysis Checklist
- What is your positionality in regard to the data? How will it affect your analysis?
- How will you organize and prepare your raw data for analysis?
- Read and engage with all of your data.
- Code. What themes or categories are emerging across the data?
- What descriptions will you use to define and characterize your codes?
- Are the codes and/or themes interrelated? Are there sub-codes?
- How will you represent codes in the final report?
- What theories can you use to interpret the codes?
- What do your themes, codes, and descriptions mean in relation to your research question(s)?
- Would a Critical Friend or colleague’s review of your analysis add to the trustworthiness of the study?
