9 A Systems Dynamics View of Humanitarian Efforts (Ryan)
Overview
System dynamics is the name given to a modeling approach that captures how the processes and parts of a system interact and influence the overall behavior of a system. It is, at first glance, a simple way of creating a model of the dynamics of a system, but when all the elements are put together, a powerful tool for modeling the behavior of a system has been created. This type of model is helpful in understanding the implications of change injected into the system.
When developing humanitarian aid plans and policies, understanding the systemic effects of the type of aid provided is an essential thing to consider. If the provided assistance is only a Band-Aid solution, the long-term problems will not be fixed. Alternatively, if the aid provided actually makes the situation worse, the entire purpose of assisting is subverted. The concept of Balanced Humanitarian Technology Security provides a framework to understand how benefits accrue; the process of System Dynamics modeling offers a way to know how each part of the overall system is affected by the insertion of technology and humanitarian aid.
After introducing the concept of “Balanced Humanitarian Technology Security, “this chapter explains how to use system dynamics as a general modeling approach, then shows how it can be used to understand humanitarian efforts, and finally addresses the question of applying advanced technologies in humanitarian efforts.
A note to readers: at the end of this chapter is a section titled “For Further Reading.” This section contains annotated references to documents that provide additional context to the material discussed in this chapter.
The author created all the graphics.
Student Learning Objectives
After studying this chapter, the student should be able to:
– Define balanced humanitarian technology security (BHTS)
– Describe the parts of a system dynamics model
– Develop and test hypotheses for improving humanitarian aid using system dynamics
– Describe the challenges associated with creating long-term positive results through aid activities
Introduction
The notion of humanitarian assistance is deeply rooted in human society, both in the sense of helping people at the lower ends of the socio-economic ladder who are in need (charity) and in the sense of helping people whose lives have been upended through forces beyond their control. These forces can include both natural forces, such as sea change or volcanic eruptions, and manmade forces, such as war and colonialism. As technological development has continued to advance, the application of technology in support of providing various levels of humanitarian assistance has proceeded apace.
Consider the following story, related to me in a letter from my mother recounting what she saw as a young girl growing up in China in the 1930s:
I lived in Suzhou for three years. The trip to that area and, later, leaving the area were always covered/crowded with fear.
We lived outside the city wall at a camel station. The city gates were permanently closed at sundown and never opened until sunrise. This walled camel station outside the city was for caravan and product protection. Our family could not live in the town proper because we were not Chinese or Turks.
Every morning, Mother would cook millet and or barley in a considerable kettle — when it was ready, she would open a small window in the main gate (to the street outside). The hungry children were already crowded by the gate (knowing Mother would bring food). She placed in each of their containers (a broken cup/ a leaf or even into their hand) one ladle of millet/barley or any other grain — whatever she could talk a shop owner to give her at a discount. Many kids were not fed because the food ran out. Later in the morning— the death squad would go up the main streets, picking up dead children and older people. Every morning was the same exercise for two years until we left that area for Lanzhou & civilization.
It’s not an event one forgets quickly.
This simple story contains all the elements of the challenge addressed by this book: suffering humans, people willing and able to help, and technology. My grandmother used both process and product technologies to help. The product technology was the massive kettle in which she cooked the grains, the spoon she used to portion it out, and the window through which she metered her efforts. The process technology was her knowledge of and expertise in bartering with the shopkeepers. These may seem like very primitive technologies, and by our standards, they are, but for the starving children who had no way of accessing either type of technology, they must have seemed like godsends.
The question that arises after reading such a story inevitably includes some version of “What happened to the children who did get the food?” This is a way of examining the long-term effect of these charitable efforts. The work my grandmother did in feeding those children was a deviation from the system dynamics at play in the environment. That simple act changed the overall dynamics of the system at large. So, we must ask the following question: Was the outcome good or bad for the overall system? And then comes the problem of defining good or bad.
Defining outcomes as good or bad is, of course, both situational and temporal. For the children who got to eat that day, the result was excellent. In order to understand the impacts of the more significant system, we have to consider the larger context over a more extended period. Further, we must do that not from the perspective of a single child but from the perspective of the entire system, including remotely affected elements. In doing so, we tease out the dynamics of the system: how different elements affect each other and how such effects propagate throughout the system. And once we have done that, a certain magic occurs. When we have the model built, tested, and verified, then we can model changes to the system. These hypothetical changes include the insertion of technology, changes in processes, the use of incentive structures, and other behavioral change mechanisms. This process is called system dynamics analysis.
However, there is more to the analytical challenge than simply being able to model an existing system (or system of systems) and test potential changes. There is also the need to have a theory of what one is trying to accomplish. In this particular situation, our focus is on using advanced technologies for humanitarian assistance. As such, it is essential to have a theoretical framework for understanding the overall needs and objectives from a very general perspective. For that, we need a defined concept of balanced humanitarian technology security.
Balanced Humanitarian Technology Security (BHTS)
To start, let’s consider the word “humanitarian.” The word itself can be used either as a noun or an adjective, but the most important thing to our concern is how it is used in common parlance. We talk about a person being a humanitarian to denote that they are looking to make things better for people. We also talk about events in terms of their effects on humans, such as the humanitarian impacts of natural disasters or warfare. An often-heard usage is describing a situation as a humanitarian crisis, with the implication that there is an immediate and different need for help, without which the situation will get dramatically worse.
These definitions are helpful to readers trying to understand the meaning of words in context but are of limited use at the interface of meaning and action, which is where our problem lies. The actions we are concerned with are the application of technology, particularly advanced technology, for the use and benefit of humankind. However, the practical effects of inserting technology into human life, even with the highest humanitarian intentions (as in to promote or improve human welfare), can sometimes have precisely the opposite effect. For example, one of the very well-researched contrary situations is that of the impact of providing clothing to poor populations. The intent is good: to make it easier for the poor populations to access clothing. However, the long-term effects of such charitable giving are to drive local clothing manufacturers out of business, which has a harmful impact on regional economic activity, ultimately driving more people deeper into poverty.
Because of this challenge, it is essential to have a concept of the challenge that includes both the aspiration of helping humankind as well as the reality of the need for controls to preclude outcomes that either do not help the humans at issue or, in the worst cases, actually harm the humans that are at issue. In this light, I use the theoretical construct of “balanced humanitarian technology security” or BHTS, which includes three elements:
— the humanitarian aspiration of making life better for the targeted population
— the requirement to analyze the system dynamics of the population’s reality to understand the likely effects of technology insertion
— the implications of insertion of advanced technology into poor, marginalized, or needy communities.
BHTS invokes the humanitarian aspirations of technology usage. We want to use technology wisely to solve both immediate challenges and create long-term benefits for people. Because every new or advanced technology comes with both infrastructure needs and a learning curve, this means that any insertion of advanced technology must include an analysis of how it will mesh with the existing cultural and societal situation, how an appropriate infrastructure for long-term support will be developed, and how the local population will be educated and trained with regards to the uses and benefits of the technologies.
BHTS also invokes the need for balance, which implies analysis. In order to do a comprehensive analysis of all the components of the situation, it is essential to include both the immediate needs of the population as well as all of the cultural, environmental, economic, political, and societal variables, including the existing technological base and energy infrastructure. Understanding acceptance of change is particularly important.
Finally, BHTS invokes the concept of security, which is a term of art in aid circles that is somewhat different than its usage in other areas.
For example, the concept of “food security” includes several elements. First, the food actually has to exist. You can’t have food security if it doesn’t even exist. Secondly, it must be available in the place where it is needed. You can’t have food security if the people can’t get the food. Thirdly, it must be affordable. You can’t have food security if the people can’t access the food legally. And finally, the food must meet the nutritional needs of the population. You can’t have food security if the type of food available does not provide adequate nutrition to sustain life.
Technology is more complex than food in that it is created by humans in one cultural context and possibly applied by humans in a different cultural, ecological, and economic context. Therefore, BHTS includes these six propositions:
— the technology must provide some benefit to humankind
— the technology must be available to the targeted population, either in situ or through proxy use (for example, remote sensing products that are provided to the people)
— the technology must be affordable to the targeted population
— the technology must be acceptable in the culture of the targeted population
— the technology must be useable and useful
— the technology must not create systemic disruptions that create more harm than good
The value of these six components of BHTS becomes apparent when one considers the negative of each proposition. If the technology does not provide benefit to humankind, why use it? If the technology is not available to the targeted population, it will not be of any use. If the technology is available but not affordable to the targeted population, it won’t be used. If the targeted population does not accept the technology, then it will not only not be used but might actually be sabotaged. If the technology is neither useable nor valuable, then it does not provide any benefit. Finally, if using the technology in one area creates harm in other parts of the system, then the overall benefit is negative, and the targeted population is not helped.
This theoretical construct is quite complex: there are a lot of things to consider. Trying to consider all these things in isolation would be a daunting and ultimately fruitless task, where the power of system dynamics analysis comes into play.
System Dynamics Analysis
Three questions must be addressed before getting to the actual modeling process. First, it is essential to know how to define a system. Secondly, the types of dynamic activities must be understood. Finally, the elements of the modeling process need to be introduced.
Understanding Systems
What is a system? It seems like a simple concept, but actually defining what comprises a system can be tricky for those who have not studied it in the field. There is a straightforward definition that can be used as a starting place. That definition is that a system is a set of processes that are encapsulated within a boundary. Inputs to the processes flow from outside the boundary into the processes that are enclosed within the boundary. Outputs flow from inside to outside. The following drawing (Figure 9-1) illustrates this definition of the system.
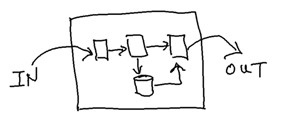
Even though this is very simplistic, it is a handy way of thinking about systems in general. There are related processes that work together, based on inputs received from outside the system, in order to produce outputs.
There can also be systems of systems (SoS). Systems of systems come to exist when independent systems are joined together to create a synergistic effect; it is a collaboration of member systems. There are six defining characteristics of a SoS.
- First, each member system is able to operate towards an end goal independently and is not reliant on the other systems for the completion of tasks/achievement of goals.
- Second, member systems are not subsystems. They exist as systems in their own right.
- Third, the SoS structure provides an overarching coordination and interaction structure that the member systems agree to be part of.
- Fourth, member system components do not operate in other member systems (although there may be similar components that exist independently in different member systems).
- Fifth, member systems accept input from and send output to other member systems under mediated/controlled conditions.
- Sixth, a more considerable coordinating function exists to manage the SoS structure.
An example of a SoS that illustrates the six defining characteristics helps to understand the concept. Consider an integrated logistics systems that include air, rail, trucks, and sea. Each of the member systems operates independently, at different speeds, and with other physical infrastructure. Creating an overarching management system that coordinates the operations allows a package to move seamlessly from a factory in China to your house with minimum time expended.
Understanding Dynamics
The concept of dynamics is based on change. There are many ways something can be dynamic. Something can be dynamic if it changes regularly, such as because of activity, planned progress, or external forces. For example, shorelines are dynamic due to the forces of tides and weather.
Since systems exist to take inputs and create outputs, they are, by definition, dynamic. Systems change due to growth or decline, external influence or change, or the impact of time. Understanding those dynamics is the focus of system dynamics analysis.
Particularly of interest is how the effects of change propagate through a system. Understanding how these effects affect other elements provides insight into how feedback loops can be created, managed, or eliminated. Feedback loops exist when the effects of change flow through a system and create a loop. The overall impact of the feedback loop can be reinforcing or baselining. Sometimes, these are referred to as positive or negative feedback loops, but this can be confusing since people tend to assume that positive feedback loops are good and negative feedback loops are nasty. This is a wrong interpretation. The goodness or badness of any feedback loop is subjective and depends very much on how the terms “good” and “bad” are operationally defined.
Resource utilization and flows are also a focus of this modeling. In particular, this modeling can help identify where things bunch up, where things work well, and how changes in one element impact other parts of the system. By understanding these dynamics, managers can make decisions regarding how to improve the overall system performance.
The Elements of System Dynamics Modeling
There are two general approaches to system dynamics modeling. One is called causal loop analysis, and the other is called stock and flow analysis. It is possible to combine both approaches in one analysis.
In order to model the dynamics of a system, we need to have components that represent the parts of a system. In general, there are places in systems where stuff accumulates, which are called stocks. Some pipelines move things between stocks, which are called flows. There are also variables, links, and loops.
Causal Loop Diagrams
To build a causal loop analysis, variables are connected using a few simple rules. Variables are the things that change (like Population, Pollution, etc.). One variable is linked to one variable (although many links are possible). The links are annotated with arrows that show the directionality of effects and whether the effect is increasing or decreasing. Finally, loops are identified that show the net impact of the changes as they propagate throughout the system.
The modeler must be sure about the relationship between the variables. Humans are fallible, and errors are possible. The worst errors come from assumptions and from misinterpreting the data. For example, if ice cream consumption increases and the murder rate also increases at the same rate, a lazy modeler might assume that there might be a causal connection between the two variables rather than looking at a different variable, such as the weather. Sources of error can come from confirmational bias, mistakes in the study design and definition, misinterpretation of data, and post hoc interpolation. It is really, really important to understand what you are studying and modeling completely. Finally, it is critical to test your completed model against reality to make sure that it is actually complete and accurate.
An example of a causal loop diagram is shown in the following graphic (Figure 9-2). This is a fundamental and simplistic example meant to illustrate the modeling components. In this diagram, there are two variables: chickens and eggs. Each variable is linked with a line that shows that the relationship is increasing (the plus sign at the arrowhead indicates this). The arrowhead indicates the directionality of the relationship. Finally, the feedback loop is identified both in terms of how the loop flows (clockwise) and the fact that it is a reinforcing feedback loop.
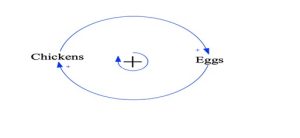
Source: AuthorTo interpret this diagram, we can say the following things. First, chickens produce eggs. Given a certain number of chickens, there will be a certain number of eggs produced. The diagram tells us that if more chickens are added, more eggs will be created. The diagram also tells us that given the number of eggs that are made, a certain number will hatch and grow up to become chickens. This, then, is the feedback loop that is identified: more chickens result in more eggs, which results in more chickens. This is a reinforcing feedback loop in that nothing exists in the diagram to moderate the increasing effects.
This diagram is obviously flawed. If all the chickens are male, the number of eggs produced will be zero. Therefore, we can also state that an unidentified assumption of this diagram is that there are at least some females in the system. Here, two more unidentified assumptions are revealed as well: first, if all of the eggs are eaten, none will hatch, and second, if all of the chickens are females, none of the eggs will be fertilized. However, since it is only an example of the methodology, we can live with these flaws.
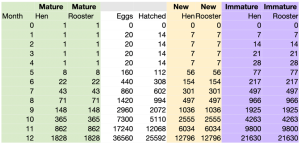
The data underlying the diagram provide insight into the magnitude of the feedback loop effects. Hens produce eggs starting at five months old. There needs to be at least one rooster and one hen to produce eggs that become chickens. The chickens need adequate nutrition and a safe environment. One hen can produce 270 eggs per year. It takes 22 days from fertilization to hatching. The life span of a chicken is from 3 to 5 years. Both chickens and eggs taste good to predators. Putting all this data into equations results in the following table:
Table 9-1: Simplified Data Illustrating the Effects of a Positive Feedback Loop
Source: Author
There are, of course, simplifying assumptions in this data: 20 eggs/month, 70% viability, 50% gender, five months from birth to egg laying, and no predation. The point here is to show what an increasing feedback loop looks like unchecked; the results can be astonishing over time.
And we do see this in nature. For example, rats reproduce at a dizzying rate, frustrating the efforts of city managers to keep them under control. As an opposite example, some nations are currently faced with human reproduction rates that are below two. Since it (usually) takes two humans to create another human, a reproduction rate of less than two results in a baselining feedback loop.
Adding predation into the basic model makes this a little more interesting. In Figure 9-3, Predators have been added as another variable. Each variable is linked to the other variables with the following relationships identified:
- All things equal, if the number of eggs increases, the number of predators increases above where it would have been
- All things equal, if the number of predators increases, the number of chickens decreases below where it would have been
- All things equal, if the number of predators increases, the number of eggs decreases below where it would have been
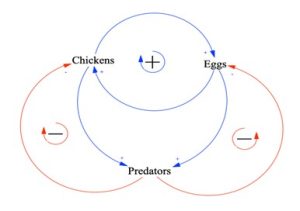
There are five feedback loops identified in this model:
- Reinforcing Loop 1: Chickens —> Eggs —> Chickens
- Baselining Loop 1: Chickens —> Eggs —> Predators —> Chickens
- Baselining Loop 2: Chickens —> Predators —> Eggs —> Chickens
- Baselining Loop 3: Chickens —> Predators —> Chickens
- Baselining Loop 4: Eggs —> Predators —> Eggs
The explanation of these loops is simple. The reinforcing loop of chickens and eggs has already been discussed. The baselining loop of chickens to eggs to predators to chickens is described as follows:
An increase in chickens leads to an increase in eggs
An increase in eggs leads to an increase in predators
An increase in predators leads to a decrease in chickens
Thus, the net effect of the introduction of predators into the model leads to a moderation of the growth in the number of chickens.
This incredibly simplistic model illustrates a critical point: the more variables you have in a model, the more complexity there will be. By adding one variable, we went from one feedback loop to five feedback loops. But this is not a bad thing. In fact, this illustrates the power of using a straightforward modeling system to create highly complex models of systems that capture the underlying complexity of interactions between the variables. The nature of the relationships is described using mathematical equations, so it is possible to illustrate the effects of interactions and change using numbers. This is quickly done using system dynamics modeling software.
Stock and Flow Modeling
A slightly different approach to causal loop modeling is called stock and flow modeling. In fact, a causal loop model can easily be transformed into a stock and flow model simply by identifying where things accumulate (stocks) and how things flow (inputs and outputs). Using stock and flow modeling helps differentiate between the different types of causal links. For example, the relationships between chickens and eggs are not the same kind of relationship. Chickens do not become eggs; they produce eggs. So, chickens are not an item that flows into the egg stock; instead, they influence the number of eggs produced. On the other hand, eggs do not make chickens; they transform into chickens. So, the item in the egg stock does flow to the chicken stock: upon hatching, the item leaves the egg stock and goes into the chicken stock (assuming it survives).
The primary components of a stock and flow diagram are stocks, flows (inputs and outputs from stocks), and influence variables. Figure 9-4 presents the chickens and eggs scenario modeled as a stock and flow diagram. Note the influence variables.
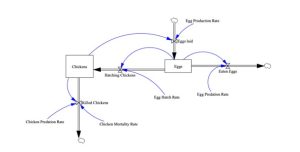
This is a more complete model, although it does not include a lot of the necessary elements for a truly complete model, such as food, environment, and hazards. Again, this simple model is presented only to illustrate the modeling concepts. There are two stocks: chickens and eggs. As eggs hatch, they are removed mathematically from the egg stock and added to the chicken stock. The egg hatch rate and the number of eggs available for hatching influence the rate at which this occurs. Eggs are also removed from the egg stock by being eaten at a rate influenced by the egg predation rate. As chickens produce eggs, eggs are added to the egg stock, but not directly from the chicken stock. Chickens are removed from the chicken stock through dying, which is influenced by the predation rate and the average mortality rate. The underlying math for a stock is the integral of the difference between inflows and outflows, added to the initial population.
Equation 9-1: Basic Equation for a Stock

Source: Author
For example, the equation for the Egg stock would be the integral of (Eggs Laid – Eggs Hatched – Eggs Eaten), assuming an initial population of zero eggs. Each of those rates would be calculated based on their influencing variables.
Use of System Dynamic Modeling
Building models of real-life situations gives you incredible insight into how the dynamics of the system work throughout the system. For example, in the above Chicken-Egg-Predator model, after verifying the model is correct against real-world data, we could inject product or process technologies and see what the effect on the overall model behavior is. For example, you could test whether investing in better protections for the chickens would result in enough of a change in the variable <rate of predation> to justify the cost of the investment.
With the right software, you can embed the equations into the model and then run simulations, testing such changes instantaneously. For example, the following model (Figure 9-5) shows an analysis of water sources and uses. The embedded lines in the stocks show the real-time hypothesis testing results when the values of the variables are changed. This model was developed to give a simplistic view of how the increased use of recycled water could benefit a town that was suffering from water shortages, so the cost of implementing the recycling technology was not nearly as necessary as actually retaining water for daily use. It must be noted, however, that economic issues are definitely crucial for most models, as few organizations have unlimited resources.
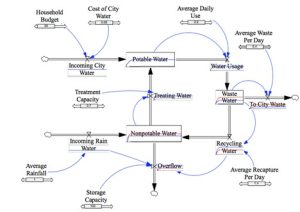
The ability to investigate both the effects and magnitude of the impact of changes to variables can provide real insight as to where changes in a system can have the most beneficial — or detrimental — impacts on all parts of the system. In fact, one must be careful to test hypotheses systematically to make sure that biases do not obscure potential benefits. Overlooking testing a variable because it seems insignificant can be a terrible mistake.
Using System Dynamics Analysis to Explore Humanitarian Assistance
The rest of this book provides a view of how advancing technologies can be of assistance in humanitarian assistance. This chapter has introduced the notion of “Balanced Humanitarian Technology Security (BHTS).” Using system dynamics modeling can allow people who are trying to help other people to figure out the right way to provide such assistance. The steps are obvious but worth identifying.
First, you must have a model of the system into which you intend to inject assistance. That model must accurately reflect the following components: population, economic activities, cultural values, environmental elements (including both natural and manmade components), political system, and relationships to external influences (such as allies or enemies). You must test this system against real-world data to determine two things: does your system correctly reflect the actual system, and can you use your model to predict the effect of changes to the system?
Next, you must understand the components of the technology (product or process) that is being considered for injection into the situation to help people. The components must include, at a minimum, the infrastructure requirements (for example, requirements for the physical plant, electrical, environmental controls, security, and emergency support), the knowledge requirements (for management, use, and exploitation), the ability to either include or not include the local population, transition requirements for introducing the technology into the existing system, and the long term support needs (for example, maintenance, logistics, upgrade cycles, and potentially transitioning to local control).
Then, it would be best if you built a model that combines all these elements with the original model so you can start to develop an understanding of the long-term systemic impacts of the proposed technology solution on humanitarian needs.
With all this optimism in mind, it bears repeating that there is only one truth about forecasting the future. The truth is that you are going to be wrong. The only question is, “How wrong?” Your goal in all of this is to minimize wrongness by being comprehensive in your analysis. But let’s be clear about this: using models and simulations is a handy way of predicting the future. All the same, it is essential to understand that pitfalls exist, so the wise use of these types of tools requires an appreciation for the complexity of fortune-telling.
Predicting the Future
One of the reasons for predicting the future is to answer this question: What will the future look like?
The reason we would like to know the answer to that question is because it informs us of what we need to do to prepare. But it also allows us to ask the question: “What can we change to get a different future?” This is the sweet spot for modeling and simulation and is precisely what humanitarian aid is all about changing the future of the people who need humanitarian assistance.
When considering this challenge, keep in mind that there are three potential futures: what will actually happen, the future that you prefer to occur, and the future that is likely to happen. The reason that the actual future and the possible future are different is because of unknowable future events. For future events, it is essential to understand two aspects: the foreseeability of the event (what) and the predictability of the time (when). (See Figure 9-6)
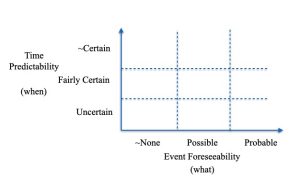
For those events with uncertain time predictability and no event foreseeability (bottom left-hand quadrant), all you can do is keep an eye out. For the events that are probable and have some certainty in time predictability, you can be more aggressive in planning for them. The others you should keep in mind and develop contingency plans for. Modeling can help you with this task.
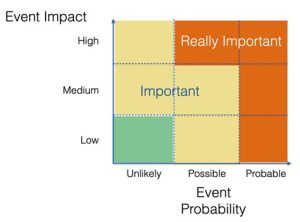
Overlaying the risks associated with the event occurring can help provide context. For every event with probability {unlikely, possible, probable}, there is an associated impact related to that event, which is reflected as {low, medium, high}. A lot of attention should be given to those events with probability possible or probable and impact high. For those that are unlikely and of low impact, less attention is necessary. Figure 9-7 reflects this spectrum of importance.
It would be best if you kept in mind that these events do not occur in a vacuum. They occur at a place and at a time. Therefore, you must overlay your analysis with a deep understanding of the local aspects of the following:
Cultural Values (religion, entitlement, expectations, social)
Economy (employment, housing, food, transportation, entertainment)
Domestic Politics (societal structures, internal conflict)
International Politics (trade, conflict, global issues, population movements)
Education (access, quality, type, level)
Demographics (size, health, locations, changes)
Environment
Technology
Energy (sources, sustainability, reliability, resilience)
Conclusions
People are complicated. What might be the right solution in one scenario might be absolutely the wrong solution in another area. Understanding each scenario requires deep knowledge across many aspects of life, which should inform your modeling efforts. Doing good is a deeply seated human value, so making sure that you are actually doing good when you intend should be a critical part of your decision-making process.
System dynamics modeling is a way to incorporate all the complicated aspects of an environment into a virtual analysis of what might happen if certain decisions are made. Spending the admittedly non-trivial amount of time to do this type of analysis can be the critical distinction between success and failure.
Questions
- Identify the three concepts underpinning Balanced Humanitarian Technology Security.
- Describe the advantages that are provided by the Balanced Humanitarian Technology Security framework.
- Identify the six components of BHTS.
- Using the simple definition of a system, describe a system that you use in your everyday life.
- Identify the six defining elements of a system of systems.
- Describe the benefits of system dynamics modeling.
- Identify the primary components of a causal loop diagram.
- Identify the primary components of a stock and flow diagram.
- Describe the difference between an influence variable and an input to a stock.
- Identify the elements of understanding the foreseeability of an event versus the predictability of the time of an event.
- Identify the elements of understanding the probability of an event versus the impact of an event and how that affects your analysis and modeling.
For Further Reading
For a non-academic and first-person description of what life was like in China in the 1930s, see the book “In the Footsteps of Genghis Khan.” It is out of print but still available on used book sites. Written by John deFrancis, it chronicles his experiences traveling across China as a young man. Published in 1993, it is an easy read, following his progress across China in the mid-1930s.
To understand the impacts of charitable giving on local economies and the environment, see the following stories and analyses.
Traub, Amanda. “Buying TOMS shoes is a terrible way to help poor people,” Vox, July 23, 2015. Available online at https://www.vox.com/2015/7/23/9025975/toms-shoes-poverty-giving
Franklin-Wallis, Oliver. “What Really Happens to the Clothes You Donate,” GQ Magazine, July 20, 2023. Available online at https://www.gq.com/story/oliver-franklin-wallis-wasteland-excerpt
To learn more about the complexities of inserting technologies into established communities, see the following resources:
TMarikyan, D. & Papagiannidis, S. (2023) Technology Acceptance Model: A Review. In S. Papagiannidis (Ed), TheoryHub Book. Available at https://open.ncl.ac.uk / ISBN: 9781739604400
Failure in international aid. GiveWell. A discussion on aid programs that work and those that don’t, with insights. Online at https://www.givewell.org/international/technical/criteria/impact/failure-stories
To learn more about system dynamics modeling, see the website of the System Dynamics Society. https://systemdynamics.org/ This website contains resources, examples, and references.
To explore system dynamics modeling using software, see the Vensim website: https://vensim.com/. They offer an academic version of their software, as well as tutorials, to help students learn how to do system dynamics modeling using experiential learning. There are also a lot of resources available on that website.

